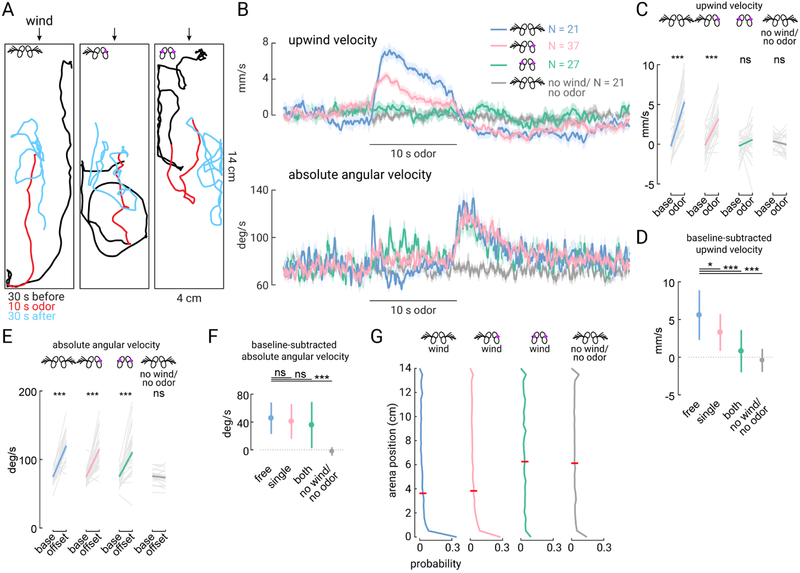
Figure 1. Both antennae contribute to odor-driven upwind orientation.
(A) Example walking trajectories during single trials consisting of wind only (black, 30 s), wind with odor (1% apple cider vinegar, red, 10 s), and wind only again (cyan, 30 s). Wind direction indicated by arrows (top of this image). Examples show a fly with intact antennae (left), one antenna stabilized (center) or both antennae stabilized (right). (B) Top: Upwind velocity (average across flies +/− standard error) in response to a 10 s odor pulse for flies with intact antennae (blue, N=22 flies), one antenna stabilized (pink, N=37), both stabilized (green, N=27), or intact antenna but no wind and no odor (gray, N = 21). Bottom: absolute angular velocity (average across flies +/− standard error) for the same flies as above. (C) Odor-evoked upwind velocity for single flies (average of 5 s during odor versus 15 s pre-odor baseline). Flies with intact antennae or one antenna stabilized increase upwind velocity during the odor, but flies with both antennae stabilized or in the absense of wind and odor do not (Mann-Whitney U test, P = 0.000040, 0.00000067, 0.11, and 0.22, respectively). (D) Average baseline-subtracted upwind velocity +/− standard deviation for the single-fly averages plotted in (C). On average, flies with each treatment walk upwind less than flies with free antennae (Wilcoxon signed-rank test, P = 0.016, 0.0000012, and 0.000000082, respectively). In the absense of wind, upwind velocity is not significantly different from zero (Wilcoxon signed-rank test, P = 0.22). (E) Odor-offset evoked increase in absolute angular velocity for single flies (average of 2 s post-odor versus 15 s pre-odor baseline). Flies in all treatments exhibit an increase in angular speed after odor offset, except in the absense of wind (Mann-Whitney U test, P = 0.000053, 0.00000017, 0.000026, and 0.26). (F) Average baseline-subtracted absolute angular velocity +/− standard deviation for the single fly averages plotted in (E). Flies with stabilized antennae are not significantly different from intact flies (Wilcoxon signed-rank test, P = 0.33, 0.18). Velocity in the absense of wind velocity is not significantly different from zero (Wilcoxon signed-rank test, P = 0.0262). (G) Probability distribution of flies along the length of the walking arena during the wind-only stimulus (no odor) for flies with free antenna (N=22 flies), single antenna stabilized (N=36), both antenna stabilized (N=26), and free antenna but no wind and no odor (N = 21). Higher position values are upwind. Red bars indicate average position. Mean position of flies is significantly different between no wind and wind (grey vs. blue, Mann-Whitney U test, P = 0.000034). Mean position is not significantly different between flies with one antenna stabilized and flies with free antennae (pink vs. blue, P = 0.29), or between flies with both antennae stabilized and intact antennae but no wind (green vs. grey, P = 0.93). All comparisons were corrected with the Bonferroni method.

