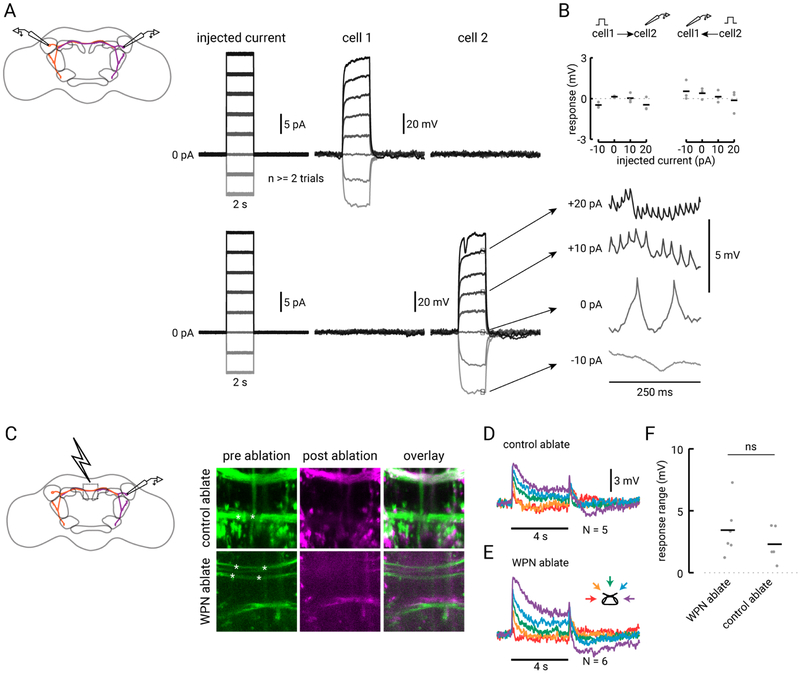
Figure 5. The contralateral arm of the WPN does not contribute to its wind tuning.
(A) Dual whole cell recording from two WPNs on opposite sides of the brain (depicted in purple and orange in the schematic to the left). On the right, top traces show current injected into cell 1 (cell body located in the right hemisphere) and resulting response in the contralateral cell 2 (left hemisphere). Below traces show current injected into cell 2 and resulting response in cell 1. Expanded traces on the right show typical changes in spike rate due to current steps in that neuron. (B) Average response of contralateral partner to current pulses for three pairs of simultaneously recorded WPNs. None of the average responses across cells are significantly different from zero (one-sample t-test, from left to right, P = 0.056, 0.077, 0.89, 0.26, 0.33, 0.24, 0.65, 0.83). (C) Ablation of WPN or control axons using a 2-photon laser light pulse. Left: central region where axons were targeted for lesioning. Right: Example z-projections of a 41.18 μM square central region of the brain where either a control set of axons (top row; 30 μM deep) or the WPN axons (bottom row; 20 μM deep) are lesioned. Left, pre-ablation GFP signal from 70B12-GAL4, with focal point of laser indicated by the white asterisks. Center: post-ablation stack of the GFP signal in the same region (magenta). Right: overlay of pre- and post-ablation images. (D) Average wind response of N=5 WPNs for flies in which we lesioned control axons. (E) Average wind response for N=6 WPNs with severed axons. (F) Mean steady state difference between ipsilateral and contralateral wind response in flies with either WPN or control axons lesioned. Average for the two conditions are not significantly different (two-sample t-test, P = 0.34).

