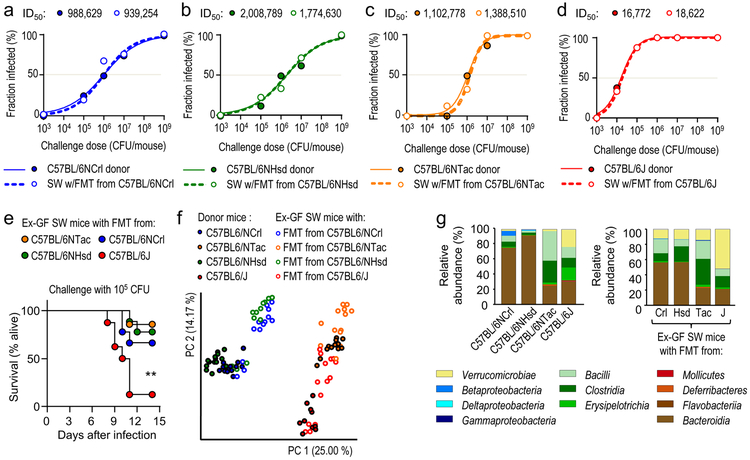
Figure 2: The gut microbiota is a driver of phenotypic variation.
(a-d) Solid lines and closed circles: Mice from Charles River Laboratories (C57BL/6NCrl) (a), Harlan (C57BL/6NHsd) (b), Taconic Farms (C57BL/6NTac) (c) or Jackson Laboratories (C57BL/6J) (d) were challenged with S. Typhimurium (n = 3–11 per dose). Closed circles indicate the fraction of animals developing intestinal carriage at different S. Typhimurium challenge doses. Dashed lines and open circles: Germ-free Swiss Webster (SW) mice received a fecal microbiota transplant from Charles River mice (C57BL/6NCrl) (a), Harlan mice (C57BL/6NHsd) (b), Taconic mice (C57BL/6NTac) (c) or Jackson mice and were subsequently challenged with the indicated S. Typhimurium challenge doses (n = 3–11 per dose). Open circles indicate the fraction of animals developing intestinal carriage at different S. Typhimurium challenge doses. The S. Typhimurium ID50 for each group of donor mice (C57BL/6NCrl, C57BL/6NHsd, C57BL/6NTac, or C57BL/6J) and each corresponding group of ex-germ-free Swiss Webster recipient mice is indicated above each graph. (e) Germ-free Swiss Webster (SW) mice received fecal microbiota transplants from the indicated donor mice (ex-germ-free SW mice) and were subsequently challenged with S. Typhimurium (n is shown in panel f). Lethal morbidity was monitored at the indicated time points after challenging ex-germ-free SW mice with 105 CFU per animal. (f) Principle coordinate analysis of fecal bacterial communities from the indicated animal groups. Each dot represents data from one animal (n = 9–15 per group). (g) 16S profiling of bacterial communities from the indicated animal groups at the class level. Each bar represents the average relative abundance of animals shown in Figure S5. LOD, limit of detection; **, P ≤ 0.01.

