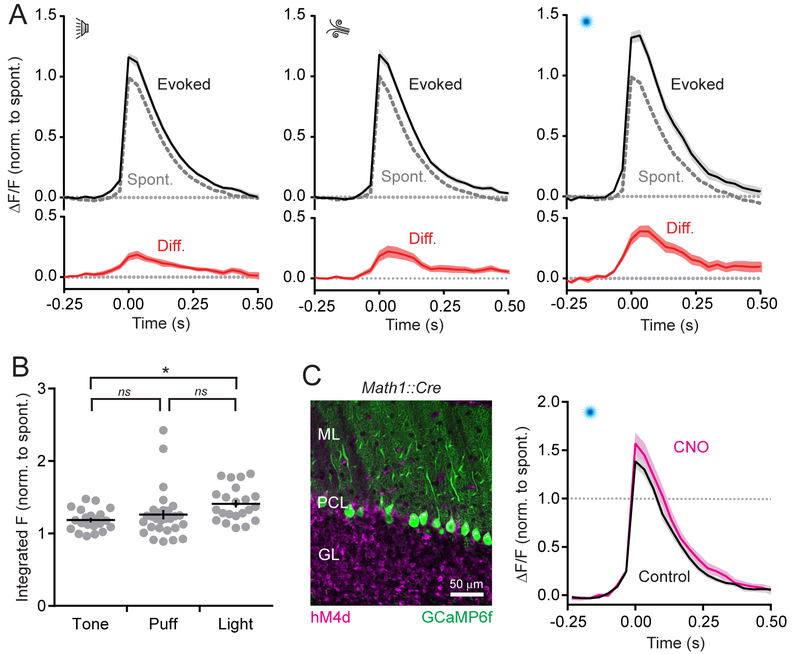
Figure 2. Graded coding of sensory-related Ca2+ events in PC dendrites.
(A) Average isolated dendritic Ca2+ events, collected across Crus I PC dendrites from all mice, during presentation of sensory stimuli. Peak amplitudes are normalized to that of spontaneous events with the difference plotted in red below.
(B) The peak amplitude of the integral for average, sensory-associated Ca2+ events, relative to that of spontaneous responses, for each block of stimulus trials (indicated by gray dots). Data are mean ± SEM; * indicates p = 0.02, ns: not significant p = 0.59 and 0.12; ANOVA with Tukey’s multiple comparison test (n = 21–28 trial blocks; 6–10 mice per condition).
(C) Left: image of hM4d-expressing granule cells and GCaMP6f-expressing PCs. Right: average isolated dendritic Ca2+ events in PCs during sensory cue presentation (light flash), normalized to that of spontaneous responses. Measurements obtained from the same regions of Crus I in control and after CNO administration (n = 9 regions from 3 mice).
See also Figures S2–S4.

