Fig. 2.
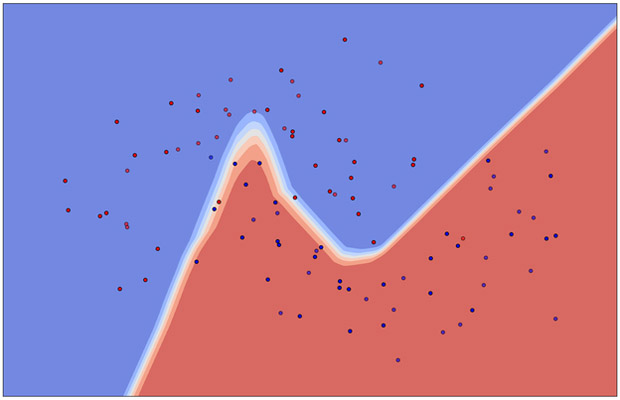
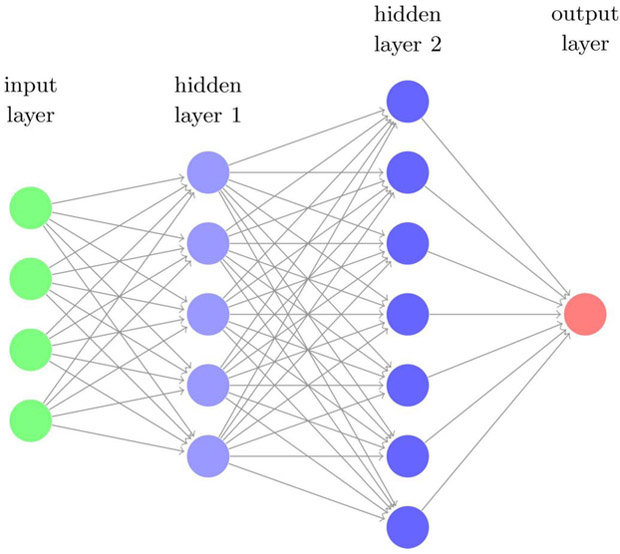
(a) (Left) An illustration of supervised learning using neural networks (right figure) classifying synthetic data of binary labels (blue and red scatter dots), where the nonlinear decision boundary is shown in white. (b) A multi-layer (deep) neural network with two hidden layers. The so-called deep learning usually refers to learning algorithms heavily relying on such computational units.


