
FIGURE 4.
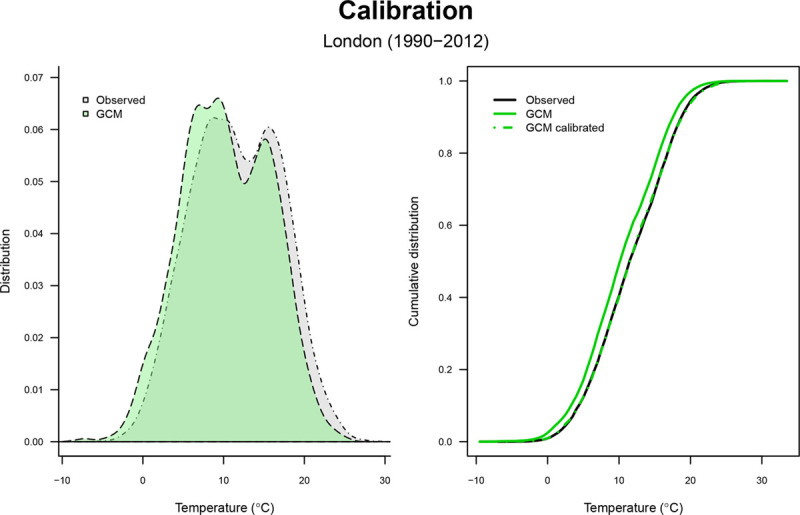
Bias correction of the modeled temperature series. Comparison between the distribution (left panel) and cumulative distribution (right panel) of the raw and bias-corrected modeled temperature , and the observed temperature series
  . GCM indicates general circulation model.