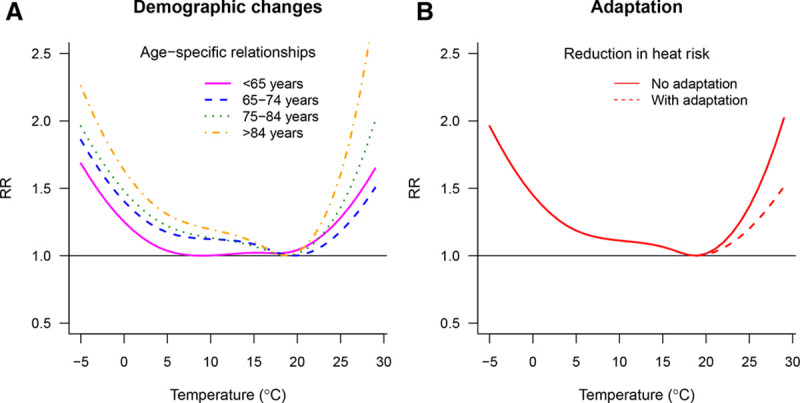
FIGURE 6.

Accounting for complex scenarios accounting for sociodemographic changes and adaptation. A, Age-specific exposure–response curves, applicable to project health impact separately for each age category, thus potentially accounting for demographic changes by using differential baseline mortality trends. B, Comparison between the exposure–response curves under scenarios of no adaptation (continuous line) and adaptation (dashed line), the latter under the (simplistic) assumption of a hypothetical attenuation of 30% in risk associated with heat. Relative risk (RR).
