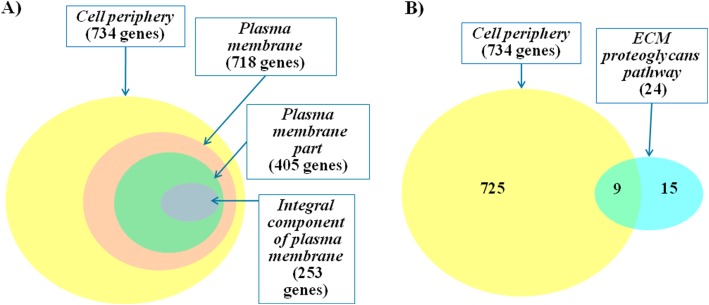
Fig. 3.
Venn diagram representing the numbers of genes from the cases_only set, annotated by overrepresented terms. Panel a – numbers of genes annotated by overrepresented GO terms; Panel b - numbers of genes annotated by the GO category Cell periphery and genes that according to REACTOME pathway database are related to ECM proteoglycans

