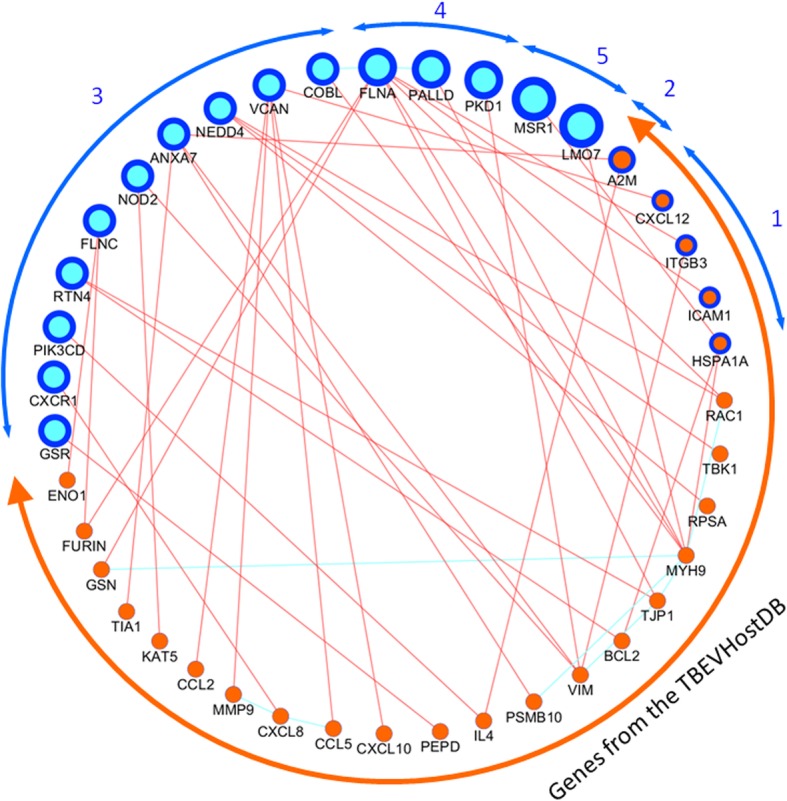
Fig. 5.

Protein-protein interactions between genes/proteins from the ECM proteoglycans - cell periphery set (blue) and genes/proteins from the TBEVHostDB (orange). Genes/proteins, for which the value of N was determined, are denoted by blue border. The size of the objects is proportional to the index N, reflecting the occurrence of the minor alleles harbored by certain gene in exomes of TBE patients (numbers in blue color)
