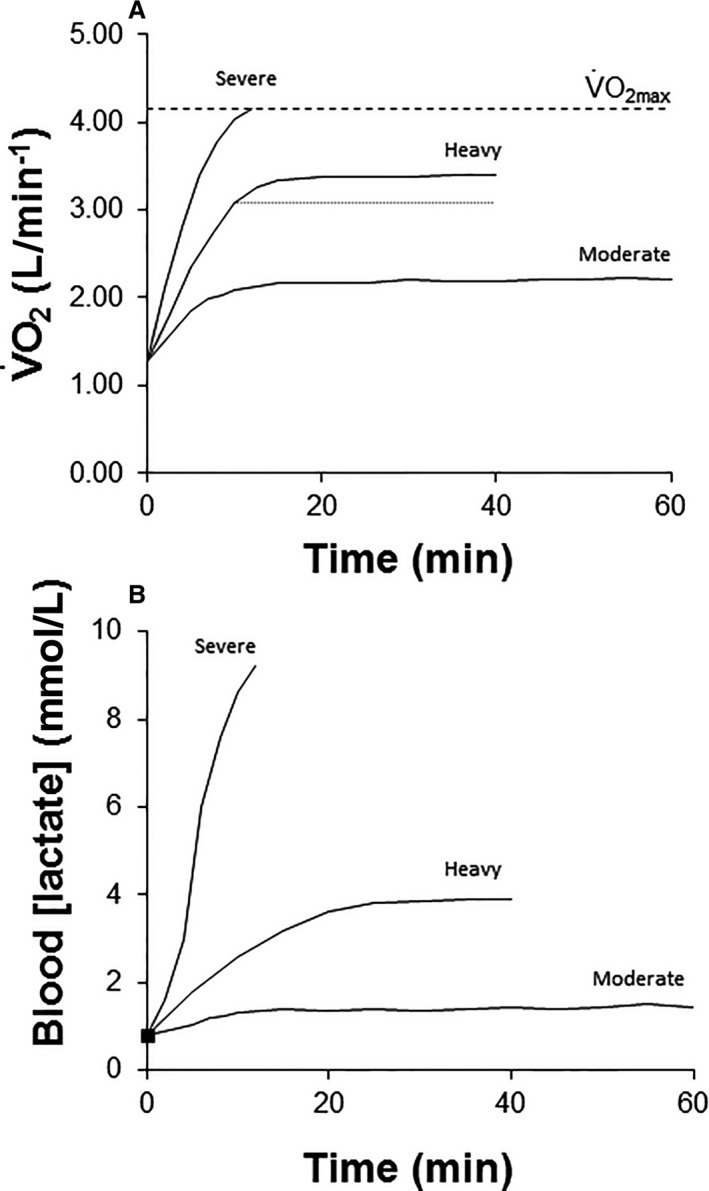
Figure 1.

Schematic representation of the pulmonary oxygen uptake (O2) (panel A) and blood [lactate] responses (panel B) during moderate‐intensity, heavy‐intensity, and severe‐intensity exercise. During moderate‐intensity exercise, O2 and blood [lactate] reach steady‐state values rapidly. During heavy‐ and severe‐intensity exercise, there is an additional oxygen cost (termed O2 slow component) above that expected from the extrapolation of the moderate‐intensity O2‐power output relationship. During heavy‐intensity exercise, the attainment of (higher amplitude) steady‐state values for O2 and blood [lactate] is delayed. The magnitude of the O2 slow component during heavy‐intensity exercise is illustrated by the dotted line provided in panel A. During severe‐intensity exercise, O2 and blood [lactate] continue to rise until O2max (panel A, dashed line) is attained with the limit of tolerance occurring shortly thereafter.
