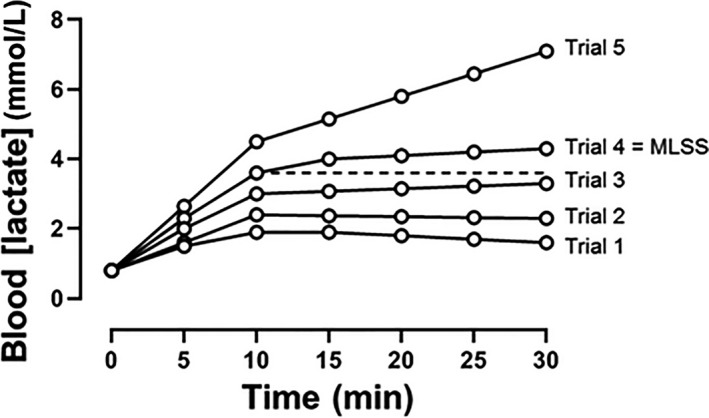
Figure 2.

Schematic representation of the blood [lactate] response to a series of constant running speed tests performed on separate days for the determination of MLSS. Trial 1 is representative of the lowest running speed chosen and each trial is indicative of an increment in speed until trial 5 (the highest running speed applied). During trials 1, 2, 3, and 4, blood [lactate] does not increase by more than 1 mmol/L between minutes 10 and 30. However, during trial 5, blood [lactate] is 4.5 mmol/L at 10 min and 7.1 mmol/L at 30 min (Δ2.6 mmol/L). Therefore, in spite of a gradual increase (Δ0.7 mM) in blood [lactate] between minutes 10 and 30, trial 4 represents the highest running speed at which blood [lactate] did not rise by more than 1 mM ‐ and it would therefore be defined as MLSS. Note therefore that the actual MLSS, according to the accepted definition, lies at a speed somewhere between trial 4 and trial 5, such that the MLSS selected (trial 4) will necessarily be an underestimate. The dashed line is indicative of the blood [lactate] attained at 10 min during trial 4, and is projected to the end of the exercise trial.
