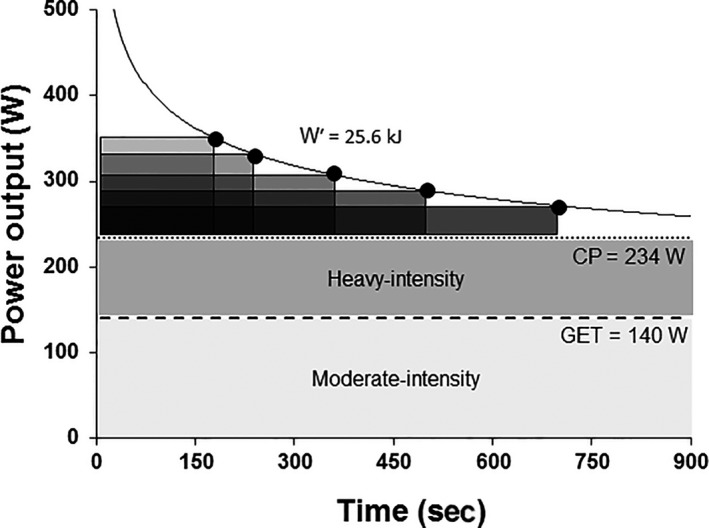
Figure 3.

Schematic representation of the power‐duration relationship with reference to the moderate‐intensity (light gray shaded area), and heavy‐intensity (dark gray shaded area) exercise intensity domains. The boundary between the moderate‐ and heavy‐intensity domains is given by the lactate or gas exchange threshold (GET), and the boundary between the heavy‐ and severe‐intensity domains is given by the critical power (CP). The CP and the work capacity available above CP (termed Wʹ) can be determined using a series of constant power output trials performed to the limit of tolerance within the severe‐intensity domain (i.e., >CP). The CP is defined as the power asymptote (234 W in this example), and Wʹ is characterized by the curvature constant (25.6 kJ in this example), of this hyperbolic relationship between power output and time. The Wʹ is capacity‐, but not rate‐, limited and therefore its contribution (in kJ) to severe‐intensity exercise is constant irrespective of exercise duration in the severe‐intensity domain. The greater the difference between the power output being sustained and CP, the more rapidly W′ will be utilized, with the limit of tolerance coinciding with the exhaustion of W′. The hyperbolic relationship between power and time can be linearized by plotting work done against time, in which case the slope of the line represents CP and the intercept represents W′, or power against 1/time, in which case the slope of the line represents W′ and the intercept represents CP.
