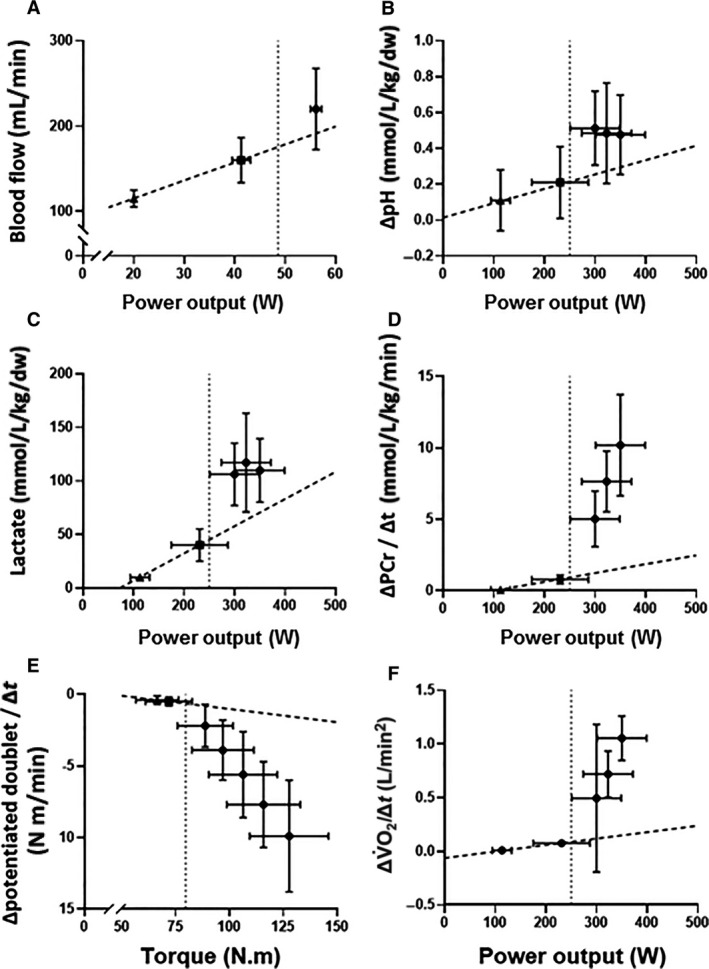
Figure 6.

Mean ± SD muscle blood flow (panel A; Copp et al. 2010), muscle metabolic perturbation (pH, panel B; lactate, panel C; Black et al. 2017), and the rates of change in muscle [PCr] (panel D; Black et al. 2017), neuromuscular excitability (panel E; Burnley et al. 2012), and pulmonary O2 (panel F; Black et al. 2017) following moderate‐intensity (triangles), heavy‐intensity (squares), and severe‐intensity (circles) exercise. The dotted vertical line indicates CP, and a line of best fit has been drawn for all trials performed below CP (i.e., moderate‐ and heavy‐intensity exercise; dashed line). Note the disproportionate changes in all variables during severe‐intensity exercise (i.e., above CP) relative to exercise performed below CP. These data delineate CP as a bioenergetic threshold above which fatigue development is expedited and muscle and systemic homeostasis is precluded.
