Abstract
Despite data-independent acquisition (DIA) has been increasingly used for relative protein quantification, DIA-based label-free absolute quantification method has not been fully established. Here we present a novel DIA method using the TPA algorithm (DIATPA) for the absolute quantification of protein expressions in human liver microsomal and S9 samples. To validate this method, both data-dependent acquisition (DDA) and DIA experiments were conducted on 36 individual human liver microsome and S9 samples. The MS2-based DIA-TPA was able to quantify approximately twice as many proteins as the MS1-based DDA-TPA method, whereas protein concentrations determined by the two approaches were comparable. To evaluate the accuracy of the DIA-TPA method, we absolutely quantified carboxylesterase 1 concentrations in human liver S9 fractions using an established SILAC internal standard-based proteomic assay; the SILAC results were consistent with those obtained from DIA-TPA analysis. Finally, we employed a unique algorithm in DIA-TPA to distribute the MS signals from shared peptides to individual proteins or isoforms and successfully applied the method to the absolute quantification of several drug-metabolizing enzymes in human liver microsomes. In sum, the DIA-TPA method not only can absolutely quantify entire proteomes and specific proteins, but also has the capability quantifying proteins with shared peptides.
Keywords: Data independent acquisition, Data dependent acquisition, Livers, Absolute protein quantification
Introduction
Liquid chromatography-tandem mass spectrometry (LC-MS/MS)-based absolute protein quantification (APQ) is frequently used for determining protein concentrations in biological systems and for analyzing proteome dynamics. Typical APQ methods quantify proteins using isotope-labeled internal standard proteins or peptides with different labeling strategies, such as metabolic labeling (stable isotope labeling using amino acids in cell culture, SILAC) [1] and chemical labeling (isobaric tags for relative and absolute quantitation, iTRAQ) [2]. However, performing APQ for the whole proteome with methods using stable isotope-labeled peptides [3] or proteins [1] is expensive and laborious. Recently, several label-free proteomics methods were developed for quantitative analysis at the proteome scale. These label-free methods often use data obtained from data-dependent acquisition (DDA) and are either based on precursor (MS1) signals, such as iBAQ [4, 5], riBAQ [6], Top3 [7], and TPA [8, 9]; or on fragment ion (MS2) spectral counts, such as emPAI [10] and APEX. It is noted that, among these methods, TPA allows for direct quantification of protein molar concentrations whereas other methods may require external standards for absolute quantification. In addition to the existing MS1- and MS2-based methods, Vildhede et al. applied a TPA-based approach to the APQ of hepatic drug transporters using triple-stage spectrometry (MS3) with tandem mass tags (TMT) labeling [12].
Data independent acquisition (DIA) has recently emerged as a powerful approach for relative protein quantification at the whole proteome level. Unlike DDA, which is biased towards selecting peptides with the strongest signal for fragmentation, DIA allows all peptides in a given m/z window to be fragmented and analyzed, resulting in a complete recording of all MS2 scans and a highly reproducible label-free quantification [13]. Schubert and colleagues reported a method for absolute quantification of proteins in Mycobacterium tuberculosis by DIA and successfully applied the assay to the study of proteome alterations during hypoxia-induced dormancy and resuscitation states [14]. This approach was based on the established linear correlation between the summed MS2 intensities and the actual concentrations of 30 anchor proteins. In the present study, we present a novel DIA-based label-free APQ method using the TPA algorithm (DIA-TPA) for absolute untargeted and targeted quantifications of human hepatic proteins without the need for anchor proteins. We evaluated the performance of this DIA-based APQ method in comparison with other APQ assays and a SILAC internal standard-based method, and found the DIA-TPA method to be highly reliable for absolute quantification of whole proteomes and targeted proteins. In addition, DIA-TPA quantified more proteins than the MS1 signal-based DDA APQ method (DDA-TPA) and was capable of quantifying different proteins and isoforms with shared peptides.
Materials and methods
Preparation of human liver S9 fractions and microsomes
Pooled human liver microsomes (HLM) (100 males and 100 females; age: 11–83 years) were purchased from XenoTech LLC (Lenexa, KS, USA). Normal human liver samples including 17 males and 19 females with ages ranging from 23 to 81 years were obtained from the University of Minnesota Liver Tissue Cell Distribution System and Cooperative Human Tissue Network (CHTN). Human liver S9 fractions (HLS9) were prepared from about 200 mg of frozen liver tissues using a previously published method [15, 16]. Briefly, liver tissues were cut into small pieces (1×1×1 mm) and homogenized in 0.5 mL ice-cold phosphate-buffered saline (PBS) in 1.5 mL microcentrifuge tubes using a microcentrifuge pestle. The homogenates were centrifuged at 9,000 g at 4°C for 20 min. Following centrifugation, the top layer containing fats was carefully removed, and the remaining samples were centrifuged again at 9000 g at 4°C for 20 min to remove the remaining fats. The resulting supernatants (S9 fractions) were collected. To prepare microsomes, S9 fractions were transferred to a Beckman ultracentrifuge tube and centrifuged at 300,000 g (80,000 rpm) for 20 min. Protein yield of the liver microsomes was 18.8 ± 6.4 mg per gram of wet liver tissue following our sample preparation procedures, which is comparable to the values reported by other studies [17, 18]. Protein concentrations of microsome S9 fractions were determined using a Pierce™ BCA protein assay kit (Thermo Fisher Scientific, Waltham, MA). The S9 fraction and microsome samples were stored at −80°C until use.
Liquid chromatography-tandem mass spectrometry (LC-MS/MS) analysis
LC-MS/MS analysis was carried out on a TripleTOF 5600 plus mass spectrometer (AB Sciex, Framingham, MA) coped with an Eksigent 2D plus LC system (Eksigent Technologies, Dublin, CA) according to a previous established protocol[16]. LC separation was performed with a trap-elute configuration including a trapping column (ChromXP C18-CL, 120 Å, 5 μm, 0.3 mm cartridge, Eksigent Technologies, Dublin, CA) and an analytical column (ChromXP C18-CL, 120 Å, 150 × 0.3 mm, 5 μm, Eksigent Technologies, Dublin, CA). The mobile phase consisted of water with 0.1% formic acid (phase A) and acetonitrile containing 0.1% formic acid (phase B, Avantor, Center Valley, PA). The trapping column was loaded by an injection of 6 μg proteins with the mobile phase A delivered at a flow rate of 10 μL/min for 3 min to trap and clean peptides, and then the samples were separated on the analytical column with a gradient elution at a flow rate of 5 μL/min. The gradient time program for the phase B was set as follows: 0 – 68 min: 3% - 30%, 68 – 73 min: 30% - 40%, 73 −75 min: 40% - 80%, 75 – 78 min: 80%, 78 – 79 min: 80% - 3%, and finally held at 3% until 90 min for column equilibration. A blank injection with water followed every sample to prevent carryover. The mass spectrometer was operated on a positive ion mode with a 50 μm ID electrode to which an ion spray voltage floating at 5500 V was applied. Ion source gas one, ion source gas two, and curtain gas were set at 28 psi, 16 psi and 25 psi, respectively, and source temperature was at 280°C.
Stable isotope labeling using amino acids in cell culture (SILAC)–based absolute protein quantification of carboxylesterase 1
The human hepatocellular carcinoma cell line HepG2, which exhibits a gene expression pattern similar to human livers, was utilized to generate a heavy stable isotope‐labeled protein internal standard for the absolute quantification of carboxylesterase 1 (CES1), an essential hepatic hydrolase responsible for the metabolism of many clinically important medications. HepG2 cells were initially cultured in DMEM containing 10% fetal bovine serum (FBS), 100 IU/mL penicillin and 100 μg/mL streptomycin at 37°C under 5% CO2 and 95% humidity. To obtain the isotope‐labeled cell culture, HepG2 cells were cultured in SILAC DMEM supplemented with 0.1 mg/mL of 13C6 L‐lysine‐2HCl and 0.1 mg/ml 13C 156N4 L‐arginine‐HCl, 10% dialyzed FBS, 100 IU/mL of penicillin and 100 μg/mL streptomycin. The medium was replaced every three days, and cells were sub-cultured upon reaching 90% confluency. HepG2 S9 fractions were prepared using a method similar to that for the liver samples. LC-MS/MS analysis showed that the incorporation rates of isotope‐labeled arginine and lysine in cell S9 fractions were greater than 99% after cells were cultured in SILAC medium for five generations or more. Thus, HepG2 cells ≥ 5 passages in SILAC culture were utilized in the study. To avoid potential variability in protein expression between different culture batches, all HepG2 SILAC S9 fractions were pooled, and the pool subsequently used throughout the entire experiment. Absolute CES1 protein concentrations in human liver S9 samples were determined using a previously established SILAC internal standard-based multiple-reaction monitoring (MRM) method [15]. Bovine serum albumin (BSA) was added before digestion to generate a retention time predictor for the estimation of retention times of CES1 tryptic peptides. Absolute CES1 concentrations were calculated from standard curves established using purified recombinant CES1 protein.
Data-dependent acquisition (DDA) analysis
Proteomic sample preparation procedures including digestion and peptide extraction were similar to those we previously reported [15, 16]. To generate a reference spectral library for DIA analysis, DDA was performed for 36 individual HLS9 samples on a TripleTOF 5600 plus mass spectrometer (AB Sciex, Framingham, MA) coupled with an Eksigent 2D plus LC system (Eksigent Technologies, Dublin, CA). The DDA experiment consisted of a 250 ms TOF-MS scan from 400 to 1250 Da, followed by an MS/MS scan in a high sensitivity mode from 100 to 1500 Da for the top 30 precursor ions from the TOFMS scan (50 ms accumulation time, 10 ppm mass tolerance, charge state from +2 to +5, rolling collision energy, and dynamic accumulation). Former target ions were excluded from MS/MS scan for 15 s. MaxQuant software (version 1.5.3, Max Planck Institute of Biochemistry, Martinsried, Germany) was used for the analysis of DDA data with default settings (peptide-to-spectrum match (PSM) false discovery rate (FDR) < 0.01, protein FDR < 0.01, the “match between runs” option was selected) and a human reference proteome FASTA file containing 21,010 protein entries and 74,856 additional protein isoforms downloaded from Uniprot on 2/1/2018.
Data-independent acquisition (DIA) analysis
DIA analysis was performed on the same Sciex TripleTOF 5600 plus system, and the experiment was comprised of a 250 ms TOF-MS scan from 400 to 1250 Da, followed by MS/MS scans from 100 to 1500 Da of all precursors in a cyclic manner using a 100-variable isolation window scheme [16]. The accumulation time was 25 ms per isolation window resulting in a total cycle time of 2.8 s. Spectronaut™ Pulsar software (version 11.0, Biognosys AG, Schlieren, Switzerland) was used to obtain MS2 signal intensities of fragment ions from DIA data with default settings (precursor q value < 0.01, protein q value < 0.01) and a reference spectral library generated from the MaxQuant analysis results of the DDA data of the 36 human liver S9 samples.
Label-free absolute protein quantification with data-independent acquisition
The label-free DIA-TPA method is based on the assumption that the ratio of MS signal of one protein to that of all proteins within a sample reflects the abundance of the protein in the sample [19]. The amount of protein i was calculated using the following equation:
To determine the mass concentration (μg/mg protein, i.e., μg of protein i per mg of total input proteins), the equation can be expressed as follows:
To determine the molar concentration (pmol/mg protein, i.e., pmol of protein i per mg of total input proteins), the equation can be expressed as follows:
When a MS2 signal is used for DIA-TPA, the MS2 signal(i) is the sum of the MS2 peak areas of all detected peptides from protein i. Each given peptide’s MS2 peak area is the sum of its fragment ions, which were obtained from the DIA data using the software Spectronaut™ Pulsar. It is noted that some detected peptides were shared by different proteins. We reasoned that the relative MS signals from unique peptides of different protein would reflect the relative abundance of these proteins, and this could be used to correctly distribute MS signals of shared peptides. Thus, MS2 signal(i) was calculated using the following equation:
In the equation, ∑ MS2 signal(i)unique is the sum of the MS2 peak areas of unique peptides from protein i, and ∑ MS2 signal(G)unique is the sum of the MS2 peak areas of peptides unique to a group of proteins that have shared peptides with protein i. MS2 signal(G)Shared is the MS2 peak areas of all peptides shared between protein i and the group of proteins. Therefore, is the redistribution of the MS2 peak areas of the shared peptides to protein i. To compare the performance of DIA-TPA with DDA MS1-based APQ (DDA-TPA), all HLS9 samples were subjected to both DIA and DDA analysis. The mathematical model of DDA-TPA is similar to that of DIA-TPA with the exception that MS1 instead of MS2 signals were used for the calculation of peak areas. The difference between TPA and DDA-TPA is that DDA-TPA redistributes MS signals of shared peptides across proteins based on the relative abundance of MS signals of unique peptides among the proteins. For DDA analysis, MS1 signal is the sum of the MS1 peak areas of all peptides detected from a given protein, determined using the MaxQuant software. For protein i having shared peptides with other proteins, MS1 signal(i) is calculated using the following equation:
In the equation, Σ MS2 signal(i)unique is the sum of the MS2 peak areas of unique peptides from protein i, and Σ MS2 signal(G)unique is the sum of the MS2 peak areas of peptides unique to a group of proteins that have shared peptides with protein i.
MS1 signal(G)Shared is the sum of the MS1 peak areas of peptides shared between protein i and the protein group. Therefore, is the redistribution of the MS1 peak areas of shared peptides to protein i.
For DIA-TPA, Total MS signal is the sum of the MS2 peak areas of all the fragment ions of all peptides reported by Spectronaut™ Pulsar under default settings (precursor q value < 0.01, protein q value < 0.01), and for DDA-TPA, Total MS signal is the sum of the MS1 peak areas of all peptides reported by MaxQuant under default settings (PSM FDR < 0.01, protein FDR < 0.01, the “match between runs” option was selected).
Quantification was only applied to proteins with at least two quantifiable unique peptides. On average, each of the quantified proteins contained four and eight unique peptides in the DIA-TPA and DDA-TPA analysis, respectively, in the present study. On average, 1957 and 567 protein isoforms per sample, which represent 62% and 52% of identified isoforms in the DIA-TPA and DDA-TPA analysis, respectively, were excluded from quantification because the isoforms did not contain or only had one unique peptide.
In addition, absolute protein quantification analysis of DDA data were conducted utilizing the established Top3, emPAI, riBAQ, and TPA methods with scripts written in Perl according to the algorithms reported in previous publications [4–8, 10]. APEX analysis of the DDA data was performed by the published APEX quantitative proteomics tool [20]. Furthermore, iBAQ analysis of the DDA data was conducted using the MaxQuant software. Correlation and linear regression analyses were performed using GraphPad Prism (version 6.02, La Jolla, CA). The proteome heatmap was drawn using the online tool Heatmapper [21]. All LC-MS/MS data have been deposited to the ProteomeXchange Consortium via the PRIDE [22] partner repository with the dataset identifier PXD010912.
Results
Absolute protein quantification of HLS9 by DIA-TPA and DDA-TPA
HLS9 contains both microsomal and cytosolic fractions and is commonly used to study the activities of drug-metabolizing enzymes [23]. We determined absolute protein concentrations for 36 individual HLS9 samples (biological replicates) using the DDA and DIA approaches described in the method section. Three additional pooled HLS9 samples (technical replicates) were included in the DIA analysis. The DIA and DDA data were analyzed by the DIA-TPA and DDA-TPA methods, respectively, for absolute protein concentrations.
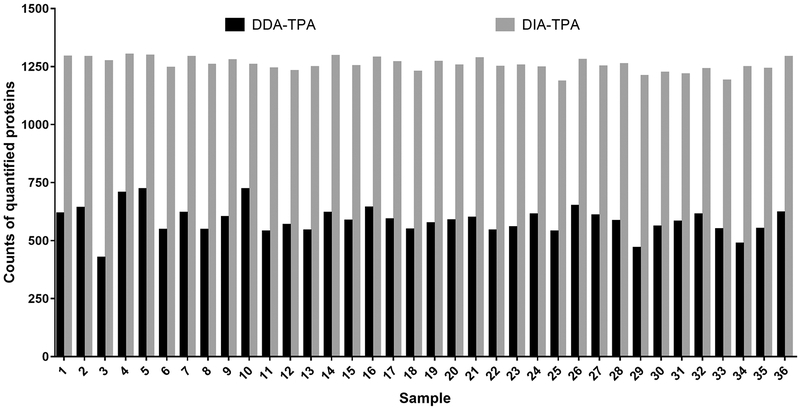
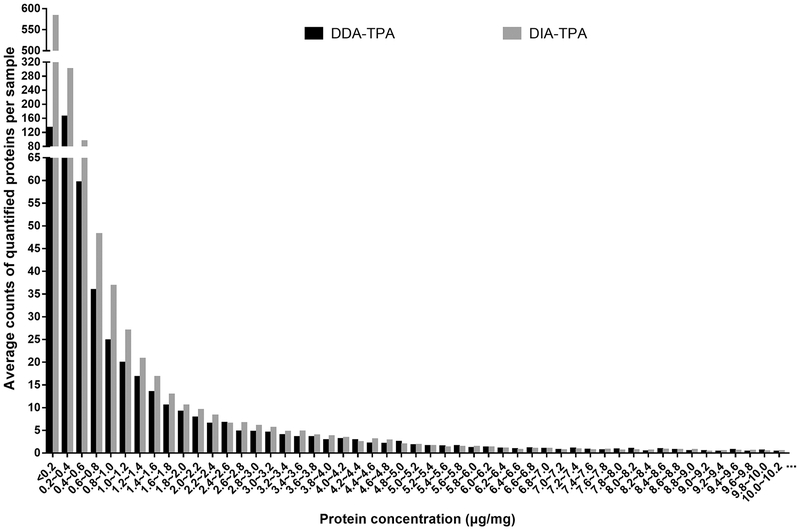
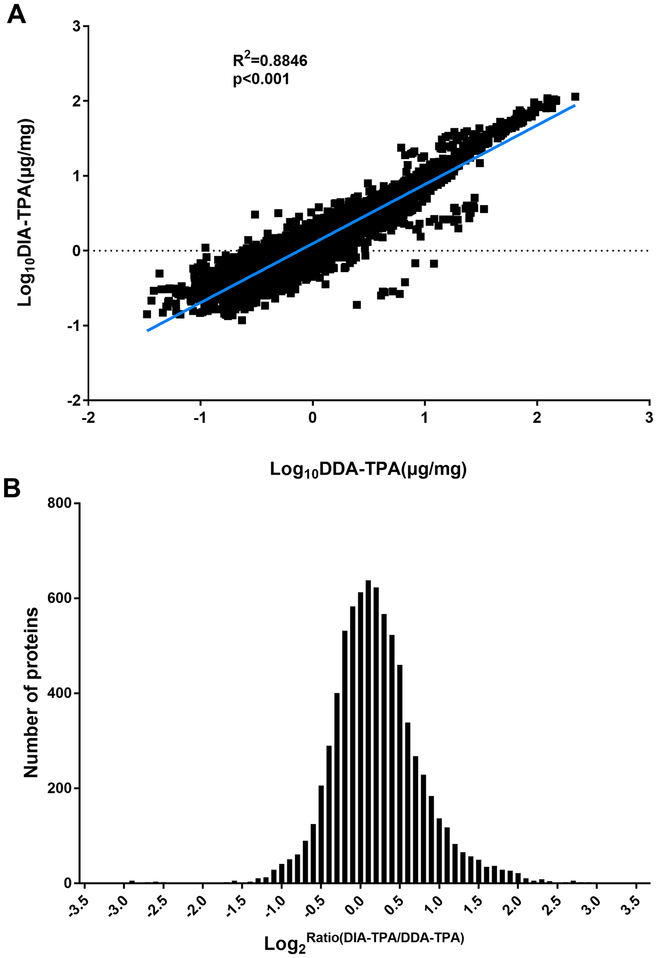
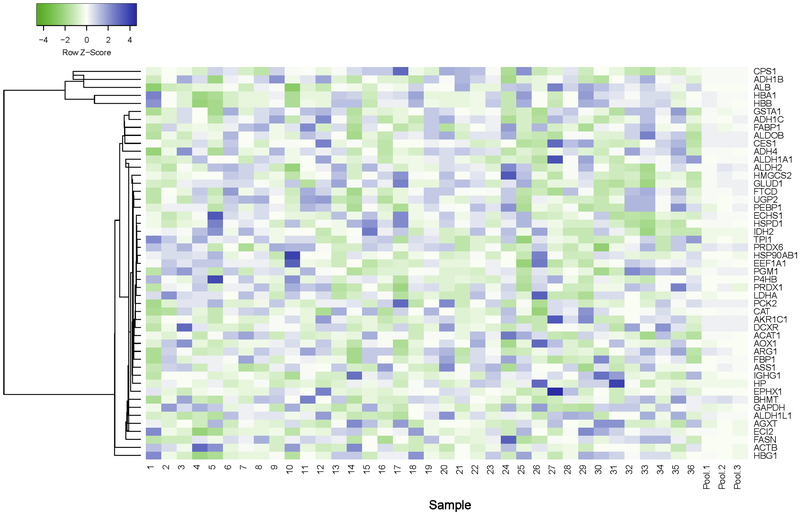
Although the DIA-TPA and DDA-TPA methods employed the same algorithm and only differed in the type of MS signals used for quantifications (i.e. MS2 vs MS1), the number of proteins quantified by DIA-TPA was more than twice that quantified by DDA-TPA in the 36 individual HLS9 samples (Figure 1). The DIA-TPA method quantified approximately 1250 proteins per HLS9 sample (range from 1183 to 1299), while DDA-TPA analysis of the same individual HLS9 samples quantified about 580 proteins per sample (range from 424 to 720). The additional proteins quantified by DIA-TPA were mainly of low concentration, indicating that DIA-TPA is superior to DDA-TPA for the quantification of low abundant proteins (Figure 2). Protein concentrations were highly consistent between the two methods (Figure 3A), and the ratios between protein concentrations determined by DIA-TPA and DDA-TPA were centered at one (i.e. 0 after log2 transformation, Figure 3B). The heatmap of the 49 most abundant proteins quantified by DIA-TPA indicated significant interindividual variability in the 36 individual HLS9 samples at the protein levels, and the pooled samples displayed medium expression levels (Figure 4).
Figure 1.
Comparison of the number of proteins quantified by DIA-TPA and DDA-TPA in 36 individual HLS9 samples.
Figure 2.
Average number of proteins determined by DIA-TPA and DDA-TPA at different concentrations in HLS9 samples. Protein concentrations are divided into 0.2 μg/mg protein intervals. DIA-TPA outperformed DDA-TPA in quantifying low abundant proteins.
Figure 3.
Comparison between protein concentrations determined by DIA-TPA and DDATPA in HLS9 samples. (A) Correlation analysis between log10 transformed protein concentrations determined by DIA-TPA and DDA-TPA in HLS9 samples. Each dot represents one protein in a given HLS9 sample. Correlation was determined by linear regression; (B) Histogram of the distribution of the ratios between the concentrations determined by DIA-TPA and those determined by DDA-TPA. The ratios were centered at one (i.e. 0 after log2 transformation) indicating an excellent consistency between the two methods.
Figure 4.
Heatmap of the concentrations of the 49 most abundant proteins determined by DIA-TPA in HLS9 samples. Significant interindividual variability existed among the samples, and the pooled samples displayed medium expression levels. Proteins with similar biological functions, such as HBB and HBA1, tended to co-vary across different samples.
Meanwhile, proteins with similar biological functions, such as HBB and HBA1, tended to co-vary across different samples (Figure 4).
Determination of CES1 protein concentrations in HLS9 by different absolute protein quantification methods
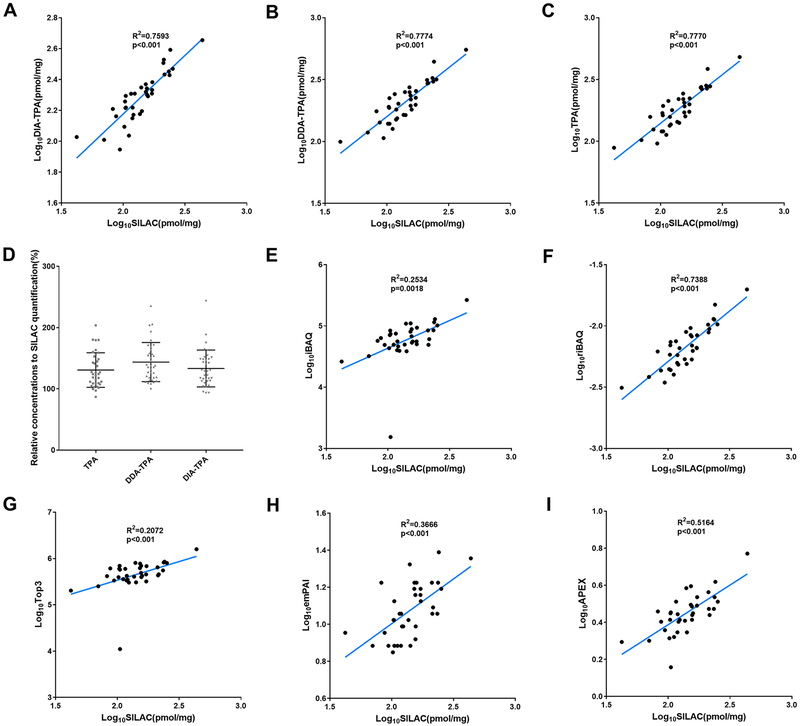
To validate the accuracy of the DIA-TPA method, we compared CES1 protein concentrations in the 36 HLS9 samples across a number of quantification methods: a SILAC internal standard-based APQ method [24], DIA-TPA, DDA-TPA and TPA [8, 9] (Figure 5). SILAC APQ is a method using non-radioactive isotopic labeling for accurate quantitation of proteins of interest [1]. Results of SILAC APQ were used as the reference values in this study. CES1 protein concentrations determined by DIA-TPA were highly consistent with those obtained using the SILAC APQ method (R2=0.7593, p value<0.001) (Figure 5A). Values were slightly overestimated by the DIA-TPA method relative to SILAC APQ with an accuracy of 133.4% ± 29.7. CES1 protein concentrations determined by the DDA-TPA, and TPA methods were also consistent with the SILAC APQ (Figure 5B–C). The accuracies of DDA-TPA, and TPA were 143.7% ± 31.5, and 130.8% ± 27.8, respectively, relative to the concentrations determined by SILAC APQ (Figure 5D). We also compared CES1 protein concentrations determined by SILAC APQ to the values determined by iBAQ [4, 5], riBAQ [6], Top3 [7], emPAI [10], and APEX[11]. riBAQ showed a better performance than iBAQ, Top3, emPAI, and APEX when compared to the results obtained from the SILAC APQ analysis(Figure 5E–I). The performance of DIA-TPA on CES1 protein quantification in HLS9 was found to be similar to DDA-TPA, TPA, and riBAQ) but superior to the others including iBAQ, Top3, emPAI and APEX.
Figure 5.
Absolute CES1 protein concentrations in HLS9 samples determined by different APQ methods. Correlation analysis between the log10 transformed protein concentrations determined by SILAC APQ and by the label-free APQ methods DIA-TPA (A), DDA-TPA (B) and TPA (C); the accuracies of DIA-TPA, DDA-TPA, and TPA compared to SILAC APQ (D). Correlation analysis between the protein concentrations determined by SILAC APQ and the values determined by the label-free APQ methods iBAQ (D), riBAQ (E), Top3 (F), emPAI (G), and APEX (H), respectively. Correlation was determined by linear regression. The accuracies of DIA-TPA, DDA-TPA, and TPA were 133.4% ± 29.7, 143.7% ± 31.5, and 130.8% ± 27.8, respectively, relative to the concentrations determined by SILAC APQ.
Concentrations of major drug-metabolizing enzymes (DMEs) in human liver microsomes (HLM) and HLS9 determined by DIA-TPA
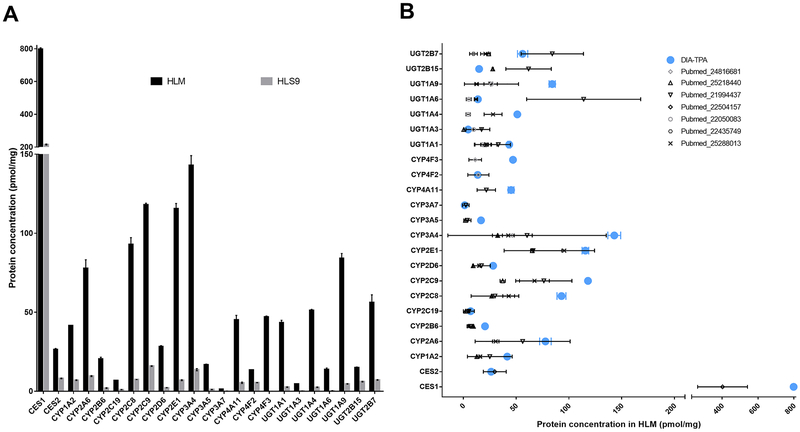
DIA-TPA employs a unique algorithm to redistribute MS signals of shared peptides across proteins based on MS signals of unique peptides of the proteins, which is critical for the quantification of proteins with similar amino acid sequences, such as cytochrome P450 (CYP) enzymes. To test the utility of this algorithm, we applied the DIA-TPA analysis to data obtained from pooled HLM and HLS9 samples for absolute quantification of the major hepatic DMEs including CYP1A2, 2A6, 2B6, 2C8, 2C9, 2C19, 2D6, 2E1, 3A4, 3A5, 3A7, 4A11, 4F2, 4F3, uridine 5’-diphospho-glucuronosyltransferase (UGT) 1A1, 1A3, 1A4, 1A6, 1A9, 2B15, 2B7, CES1, and CES2. Despite the high similarity of amino acid sequences among the CYP and UGT isoforms, DIA-TPA was able to absolutely quantify the concentrations of individual enzymes. As expected, the concentrations of DMEs were generally higher in HLM samples than in HLS9, and CES1 was the most abundant of measured enzymes across both HLM and HLS9 samples (Figure 6A). The concentrations of about half of the targeted enzymes obtained from the DIA-TPA analysis were within the ranges of the values reported by previous labeled internal standard-based absolute quantitative proteomic studies, and the majority of the rest measurements were within two-fold of the mean values reported by the previous assays using labeled internal standards [25–31] (Figure 6B).
Figure 6.
Absolute quantification of major hepatic DMEs by the DIA-TPA method. (A) Concentrations of CYP1A2, 2A6, 2B6, 2C8, 2C9, 2C19, 2D6, 2E1, 3A4, 3A5, 3A7, 4A11, 4F2, 4F3, UGT 1A1, 1A3, 1A4, 1A6, 1A9, 2B15, 2B7, CES1, and CES2 in pooled HLM and HLS9 samples. The concentrations of the DMEs were higher in HLM samples than in HLS9, and CES1 was the most abundant of measured enzymes across both HLM and HLS9 samples; (B) The quantification results are consistent with the data from previous labeled internal standard-based absolute quantitative proteomic assays. The majority of the DME concentrations obtained through the DIA-TPA analysis were within two-fold of the mean values reported by previous assays using labeled internal standards.
Discussion
Targeted quantitative proteomics with isotope-labeled internal standards is the gold standard for APQ. However, isotope-labeled standards are expensive, and the preparation of these standards is laborious, thus these methods are not ideal for large-scale APQ. Label-free APQ methods enable the determination of absolute protein concentrations at the proteome scale with much lower cost than for labeled internal standard-based APQ methods. Label-free APQ is based on the assumption that a linear correlation exists between absolute concentration of a protein and the MS signals of all peptides from the protein. Although MS intensities of a peptide can vary by several orders of magnitude from another peptide with the same concentration, a robust linear correlation has been observed between the sum of MS signals of all peptides of a protein to the protein concentration [8, 14]. Current label-free methods are mainly based on the analysis of MS1 signals, or MS2-spectral counts from DDA data [4, 5, 7, 8, 10, 20]. However, DDA is biased to high abundant peptides due to its semi-stochastic nature, and MS1 signals are generally less selective relative to MS2 signals particularly for lower abundant peptides [32]. DIA records all fragment ions (MS2) of detectable peptide precursors, and thus, has been increasingly utilized in quantitative proteomic studies [33]. A previous study developed a DIA-based APQ method by establishing the linear correlation between the summed MS2 intensities and the actual protein concentrations of 30 selected anchor proteins, and the method was successfully used to characterize Mycobacterium tuberculosis proteomes during hypoxia-induced dormancy and resuscitation states [14]. In this study, we reported a novel APQ method for label-free absolute protein quantification using DIA data and applied it to both targeted and untargeted APQ analysis of HLM and HLS9 samples.
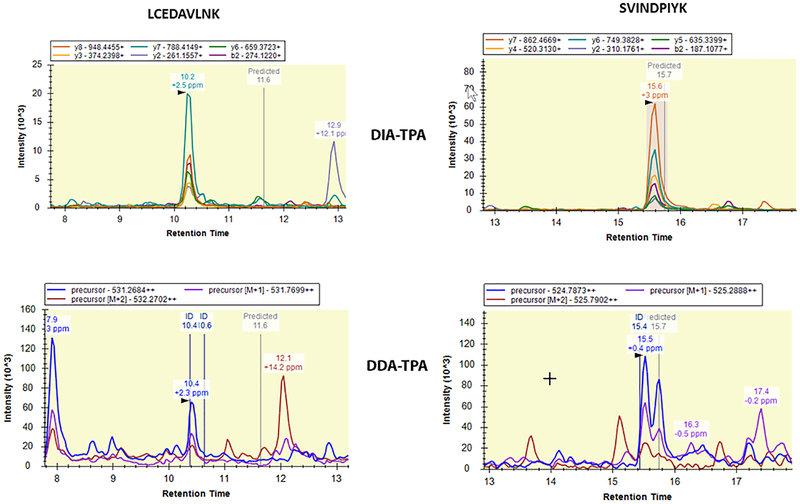
Interestingly, we found that although the two APQ methods share a similar algorithm, DIA-TPA quantified much more proteins than DDA-TPA across the HLS9 samples (Figure 2). In particular, DIA-TPA outperformed DDA-TPA for low abundant proteins while the two methods quantified a similar number of high abundant proteins, which is likely due to the higher selectivity of MS2 compared to MS1 [34] as exemplified in the quantification of the low abundant peptides LCEDAVLNK and SVINDPIYK (Figure 7). The concentrations of proteins quantified in common by the two methods were in good agreement.
Figure 7.
Performances of DIA-TPA and DDA-TPA on the quantification of low abundant peptides. Chromatograms of DIA-TPA and DDA-TPA for the tryptic peptides LCEDAVLNK (left panel) and SVINDPIYK (right panel) of UGT2B17 were generated from the Skyline software. The signal-to-noise ratios of the peaks of the two peptides were much greater in DIA-TPA than in DDA-TPA, which is due to that MS2 signals used in the DIA-TPA analysis are more selective relative to MS1 signals used in DDA-TPA.
To evaluate the accuracy of the DIA-TPA method, we determined the absolute concentrations of CES1 in HLS9 samples using an established SILAC internal standard-based method [15] and compared its results with those from DIA-TPA and other label-free DDA data-based protein quantification methods including DDA-TPA, iBAQ [4, 5], riBAQ [6], Top3 [7], emPAI [10], APEX [11], and TPA [8, 9]. The CES1 protein was consistently determined by the various methods, and all label-free methods had results comparable to those obtained from the SILAC method (Figure 5). Different statistical algorithms were employed in these label-free quantitative proteomics methods. iBAQ determines the abundance of a protein by dividing the total precursor intensities by the number of theoretically observable peptides of the protein. riBAQ is similar to iBAQ except that each protein’s iBAQ value was normalized to the sum of all iBAQ values to obtain its riBAQ value. For the Top3 approach, protein abundance was estimated based on the average intensity of the top three ionizing peptides of the protein [7]. emPAI quantifies protein content by dividing the number of observed peptides by the number of observable peptides of the protein followed by an exponential transformation [10]. APEX, a modified spectral counting method, compares the predicted spectral count to the protein’s observed MS total spectral count to compute its abundance [11]. TPA method can determine copy numbers or absolute amounts of proteins by comparing the MS signal of individual proteins with the total MS signal of the measured proteome [9]. Among these methods, DIA-TPA, DDA-TPA, TPA, and riBAQ showed similar performance (R2 > 0.7) on CES1 quantification and were superior to the other methods including iBAQ (R2=0.253), Top3 (R2=0.207), emPAI (R2=0.367), and APEX (R2=0.516). It is noted that normalization to total MS signal is a shared feature of DIA-TPA, DDA-TPA, TPA, and riBAQ, but absent in iBAQ, Top3, emPAI, and APEX, suggesting that the total MS signal normalization may improve quantification accuracy.
The existence of shared peptides presents a significant challenge in quantifying proteins with similar amino acid sequences. For relative protein quantification, shared peptides can be ignored, and only unique peptides are used for the determination of protein abundance. However, the information of shared peptides is critical for the estimation of absolute protein concentrations. The existing label-free APQ methods often treat proteins with shared peptides as a protein group and forego quantifying individual proteins. However, it is important to be able to quantify individual proteins or protein isoforms because even highly similar protein isoforms may exhibit distinct biological functions. For example, the CYP2C isoforms CYP2C9 and CYP2C19 preferentially catalyze the metabolism of different substrate medications. Several mathematical models have been developed to redistribute the MS signals from shared peptides to individual proteins [35–38]. In the present study, to quantify individual proteins with shared peptides, we proposed a simple yet effective algorithm to redistribute MS signals from shared peptides to appropriate proteins or protein isoforms according to the relative abundance of unique peptides among the proteins. This method was successfully applied to the analysis of several CYP, UGT, and CES isoforms in HLS9 and HLM samples; the quantification results were consistent with those obtained from previously published isotope-labeled internal standard-based proteomics studies.
In summary, we have established a novel DIA data-based method for absolute protein quantification at the proteome level with the capacity of quantifying proteins with shared peptides. Given that DIA has become a preferred method in quantitative proteomics studies, we expect that this DIA-TPA approach will be widely used for the absolute quantification of whole proteomes or specific proteins of interest.
Significance.
Data independent acquisition (DIA) has emerged as a powerful approach for relative protein quantification at the whole proteome level. However, DIA-based label-free absolute protein quantification (APQ) method has not been fully established. In the present study, we present a novel DIA-based label-free APQ approach, named DIA-TPA, with the capability absolutely quantifying proteins with shared peptides. The method was validated by comparing the quantification results of DIA-TPA with that obtained from stable isotope-labeled internal standard-based proteomic assays.
Highlights.
The MS2-based DIA-TPA quantifies more proteins than the MS1-based DDA-TPA.
DIA-TPA showed consistent results with stable isotope-labeled internal standard-based proteomic assays.
DIA-TPA has the capability for absolute quantification of proteins with shared peptides.
Acknowledgements
This work was partially supported by the University of Michigan MCubed program and the National Institutes of Health National Heart, Lung, and Blood Institute [Grant R01HL126969, Hao-Jie Zhu].
Footnotes
Publisher's Disclaimer: This is a PDF file of an unedited manuscript that has been accepted for publication. As a service to our customers we are providing this early version of the manuscript. The manuscript will undergo copyediting, typesetting, and review of the resulting proof before it is published in its final citable form. Please note that during the production process errors may be discovered which could affect the content, and all legal disclaimers that apply to the journal pertain.
Reference
- [1].Hanke S, Besir H, Oesterhelt D, Mann M, Absolute SILAC for accurate quantitation of proteins in complex mixtures down to the attomole level, J Proteome Res 7(3) (2008) 1118–30. [DOI] [PubMed] [Google Scholar]
- [2].Wiese S, Reidegeld KA, Meyer HE, Warscheid B, Protein labeling by iTRAQ: a new tool for quantitative mass spectrometry in proteome research, Proteomics 7(3) (2007) 340–50. [DOI] [PubMed] [Google Scholar]
- [3].Picotti P, Rinner O, Stallmach R, Dautel F, Farrah T, Domon B, Wenschuh H, Aebersold R, High-throughput generation of selected reaction-monitoring assays for proteins and proteomes, Nat Methods 7(1) (2010) 43–6. [DOI] [PubMed] [Google Scholar]
- [4].Schwanhausser B, Busse D, Li N, Dittmar G, Schuchhardt J, Wolf J, Chen W, Selbach M, Corrigendum: Global quantification of mammalian gene expression control, Nature 495(7439) (2013) 126–7. [DOI] [PubMed] [Google Scholar]
- [5].Schwanhausser B, Busse D, Li N, Dittmar G, Schuchhardt J, Wolf J, Chen W, Selbach M, Global quantification of mammalian gene expression control, Nature 473(7347) (2011) 337–42. [DOI] [PubMed] [Google Scholar]
- [6].Shin JB, Krey JF, Hassan A, Metlagel Z, Tauscher AN, Pagana JM, Sherman NE, Jeffery ED, Spinelli KJ, Zhao H, Wilmarth PA, Choi D, David LL, Auer M, Barr-Gillespie PG, Molecular architecture of the chick vestibular hair bundle, Nat Neurosci 16(3) (2013) 365–74. [DOI] [PMC free article] [PubMed] [Google Scholar]
- [7].Silva JC, Gorenstein MV, Li GZ, Vissers JP, Geromanos SJ, Absolute quantification of proteins by LCMSE: a virtue of parallel MS acquisition, Mol Cell Proteomics 5(1) (2006) 144–56. [DOI] [PubMed] [Google Scholar]
- [8].Wisniewski JR, Hein MY, Cox J, Mann M, A “proteomic ruler” for protein copy number and concentration estimation without spike-in standards, Mol Cell Proteomics 13(12) (2014) 3497–506. [DOI] [PMC free article] [PubMed] [Google Scholar]
- [9].Wisniewski JR, Ostasiewicz P, Dus K, Zielinska DF, Gnad F, Mann M, Extensive quantitative remodeling of the proteome between normal colon tissue and adenocarcinoma, Mol Syst Biol 8 (2012) 611. [DOI] [PMC free article] [PubMed] [Google Scholar]
- [10].Ishihama Y, Oda Y, Tabata T, Sato T, Nagasu T, Rappsilber J, Mann M, Exponentially modified protein abundance index (emPAI) for estimation of absolute protein amount in proteomics by the number of sequenced peptides per protein, Mol Cell Proteomics 4(9) (2005) 1265–72. [DOI] [PubMed] [Google Scholar]
- [11].Lu P, Vogel C, Wang R, Yao X, Marcotte EM, Absolute protein expression profiling estimates the relative contributions of transcriptional and translational regulation, Nat Biotechnol 25(1) (2007) 117–24. [DOI] [PubMed] [Google Scholar]
- [12].Vildhede A, Nguyen C, Erickson BK, Kunz RC, Jones R, Kimoto E, Bourbonais F, Rodrigues AD, Varma MVS, Comparison of Proteomic Quantification Approaches for Hepatic Drug Transporters: Multiplexed Global Quantitation Correlates with Targeted Proteomic Quantitation, Drug Metab Dispos 46(5) (2018) 692–696. [DOI] [PubMed] [Google Scholar]
- [13].Huang Q, Yang L, Luo J, Guo L, Wang Z, Yang X, Jin W, Fang Y, Ye J, Shan B, Zhang Y, SWATH enables precise label-free quantification on proteome scale, Proteomics 15(7) (2015) 1215–23. [DOI] [PubMed] [Google Scholar]
- [14].Schubert OT, Ludwig C, Kogadeeva M, Zimmermann M, Rosenberger G, Gengenbacher M, Gillet LC, Collins BC, Rost HL, Kaufmann SH, Sauer U, Aebersold R, Absolute Proteome Composition and Dynamics during Dormancy and Resuscitation of Mycobacterium tuberculosis, Cell Host Microbe 18(1) (2015) 96–108. [DOI] [PubMed] [Google Scholar]
- [15].Wang X, Liang Y, Liu L, Shi J, Zhu HJ, Targeted absolute quantitative proteomics with SILAC internal standards and unlabeled full-length protein calibrators (TAQSI), Rapid Commun Mass Spectrom 30(5) (2016) 553–61. [DOI] [PMC free article] [PubMed] [Google Scholar]
- [16].Shi J, Wang X, Lyu L, Jiang H, Zhu HJ, Comparison of protein expression between human livers and the hepatic cell lines HepG2, Hep3B, and Huh7 using SWATH and MRM-HR proteomics: Focusing on drug-metabolizing enzymes, Drug Metab Pharmacokinet 33(2) (2018) 133–140. [DOI] [PMC free article] [PubMed] [Google Scholar]
- [17].Barter ZE, Bayliss MK, Beaune PH, Boobis AR, Carlile DJ, Edwards RJ, Houston JB, Lake BG, Lipscomb JC, Pelkonen OR, Tucker GT, Rostami-Hodjegan A, Scaling factors for the extrapolation of in vivo metabolic drug clearance from in vitro data: reaching a consensus on values of human microsomal protein and hepatocellularity per gram of liver, Curr Drug Metab 8(1) (2007) 33–45. [DOI] [PubMed] [Google Scholar]
- [18].Barter ZE, Chowdry JE, Harlow JR, Snawder JE, Lipscomb JC, Rostami-Hodjegan A, Covariation of human microsomal protein per gram of liver with age: absence of influence of operator and sample storage may justify interlaboratory data pooling, Drug Metab Dispos 36(12) (2008) 2405–9. [DOI] [PubMed] [Google Scholar]
- [19].Wisniewski JR, Label-Free and Standard-Free Absolute Quantitative Proteomics Using the “Total Protein” and “Proteomic Ruler” Approaches, Methods Enzymol 585 (2017) 49–60. [DOI] [PubMed] [Google Scholar]
- [20].Braisted JC, Kuntumalla S, Vogel C, Marcotte EM, Rodrigues AR, Wang R, Huang ST, Ferlanti ES, Saeed AI, Fleischmann RD, Peterson SN, Pieper R, The APEX Quantitative Proteomics Tool: generating protein quantitation estimates from LC-MS/MS proteomics results, BMC Bioinformatics 9 (2008) 529. [DOI] [PMC free article] [PubMed] [Google Scholar]
- [21].Babicki S, Arndt D, Marcu A, Liang Y, Grant JR, Maciejewski A, Wishart DS, Heatmapper: web-enabled heat mapping for all, Nucleic Acids Res 44(W1) (2016) W147–53. [DOI] [PMC free article] [PubMed] [Google Scholar]
- [22].Vizcaino JA, Csordas A, del-Toro N, Dianes JA, Griss J, Lavidas I, Mayer G, Perez-Riverol Y, Reisinger F, Ternent T, Xu QW, Wang R, Hermjakob H, 2016 update of the PRIDE database and its related tools, Nucleic acids research 44(D1) (2016) D447–56. [DOI] [PMC free article] [PubMed] [Google Scholar]
- [23].Richardson SJ, Bai A, Kulkarni AA, Moghaddam MF, Efficiency in Drug Discovery: Liver S9 Fraction Assay As a Screen for Metabolic Stability, Drug Metab Lett 10(2) (2016) 83–90. [DOI] [PMC free article] [PubMed] [Google Scholar]
- [24].Ong SE, Blagoev B, Kratchmarova I, Kristensen DB, Steen H, Pandey A, Mann M, Stable isotope labeling by amino acids in cell culture, SILAC, as a simple and accurate approach to expression proteomics, Mol Cell Proteomics 1(5) (2002) 376–86. [DOI] [PubMed] [Google Scholar]
- [25].Michaels S, Wang MZ, The revised human liver cytochrome P450 “Pie”: absolute protein quantification of CYP4F and CYP3A enzymes using targeted quantitative proteomics, Drug Metab Dispos 42(8) (2014) 1241–51. [DOI] [PMC free article] [PubMed] [Google Scholar]
- [26].Groer C, Busch D, Patrzyk M, Beyer K, Busemann A, Heidecke CD, Drozdzik M, Siegmund W, Oswald S, Absolute protein quantification of clinically relevant cytochrome P450 enzymes and UDP-glucuronosyltransferases by mass spectrometry-based targeted proteomics, J Pharm Biomed Anal 100 (2014) 393–401. [DOI] [PubMed] [Google Scholar]
- [27].Ohtsuki S, Schaefer O, Kawakami H, Inoue T, Liehner S, Saito A, Ishiguro N, Kishimoto W, Ludwig-Schwellinger E, Ebner T, Terasaki T, Simultaneous absolute protein quantification of transporters, cytochromes P450, and UDP-glucuronosyltransferases as a novel approach for the characterization of individual human liver: comparison with mRNA levels and activities, Drug Metab Dispos 40(1) (2012) 83–92. [DOI] [PubMed] [Google Scholar]
- [28].Sato Y, Miyashita A, Iwatsubo T, Usui T, Simultaneous absolute protein quantification of carboxylesterases 1 and 2 in human liver tissue fractions using liquid chromatography-tandem mass spectrometry, Drug Metab Dispos 40(7) (2012) 1389–96. [DOI] [PubMed] [Google Scholar]
- [29].Harbourt DE, Fallon JK, Ito S, Baba T, Ritter JK, Glish GL, Smith PC, Quantification of human uridine-diphosphate glucuronosyl transferase 1A isoforms in liver, intestine, and kidney using nanobore liquid chromatography-tandem mass spectrometry, Anal Chem 84(1) (2012) 98–105. [DOI] [PMC free article] [PubMed] [Google Scholar]
- [30].Sato Y, Nagata M, Kawamura A, Miyashita A, Usui T, Protein quantification of UDP-glucuronosyltransferases 1A1 and 2B7 in human liver microsomes by LC-MS/MS and correlation with glucuronidation activities, Xenobiotica 42(9) (2012) 823–9. [DOI] [PubMed] [Google Scholar]
- [31].Yan T, Gao S, Peng X, Shi J, Xie C, Li Q, Lu L, Wang Y, Zhou F, Liu Z, Hu M, Significantly decreased and more variable expression of major CYPs and UGTs in liver microsomes prepared from HBV-positive human hepatocellular carcinoma and matched pericarcinomatous tissues determined using an isotope label-free UPLC-MS/MS method, Pharm Res 32(3) (2015) 1141–57. [DOI] [PMC free article] [PubMed] [Google Scholar]
- [32].Domon B, Aebersold R, Options and considerations when selecting a quantitative proteomics strategy, Nat Biotechnol 28(7) (2010) 710–21. [DOI] [PubMed] [Google Scholar]
- [33].Li H, Han J, Pan J, Liu T, Parker CE, Borchers CH, Current trends in quantitative proteomics - an update, J Mass Spectrom 52(5) (2017) 319–341. [DOI] [PubMed] [Google Scholar]
- [34].Collins BC, Hunter CL, Liu Y, Schilling B, Rosenberger G, Bader SL, Chan DW, Gibson BW, Gingras AC, Held JM, Hirayama-Kurogi M, Hou G, Krisp C, Larsen B, Lin L, Liu S, Molloy MP, Moritz RL, Ohtsuki S, Schlapbach R, Selevsek N, Thomas SN, Tzeng SC, Zhang H, Aebersold R, Multi-laboratory assessment of reproducibility, qualitative and quantitative performance of SWATH-mass spectrometry, Nat Commun 8(1) (2017) 291. [DOI] [PMC free article] [PubMed] [Google Scholar]
- [35].Zhang Y, Wen Z, Washburn MP, Florens L, Refinements to label free proteome quantitation: how to deal with peptides shared by multiple proteins, Anal Chem 82(6) (2010) 2272–81. [DOI] [PubMed] [Google Scholar]
- [36].Dost B, Bandeira N, Li X, Shen Z, Briggs SP, Bafna V, Accurate mass spectrometry based protein quantification via shared peptides, Journal of computational biology : a journal of computational molecular cell biology 19(4) (2012) 337–48. [DOI] [PMC free article] [PubMed] [Google Scholar]
- [37].Jin S, Daly DS, Springer DL, Miller JH, The effects of shared peptides on protein quantitation in label-free proteomics by LC/MS/MS, J Proteome Res 7(1) (2008) 164–9. [DOI] [PubMed] [Google Scholar]
- [38].Gerster S, Kwon T, Ludwig C, Matondo M, Vogel C, Marcotte EM, Aebersold R, Bühlmann P, Statistical Approach to Protein Quantification, Molecular & Cellular Proteomics 13(2) (2014) 666–677. [DOI] [PMC free article] [PubMed] [Google Scholar]


