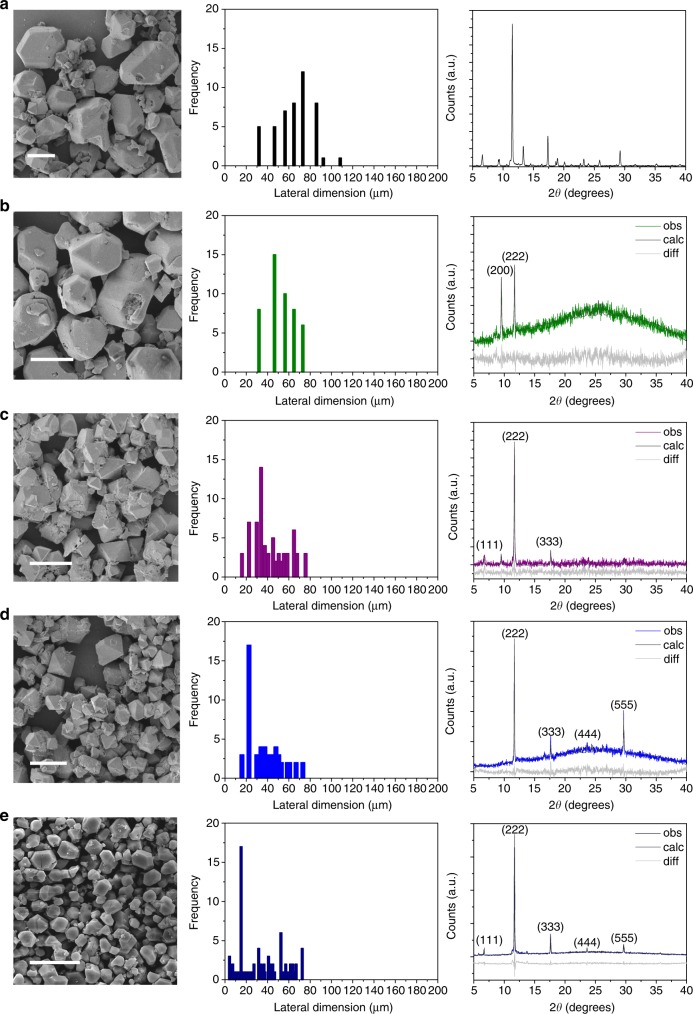
Fig. 2.
Morphology, size and orientation of the HKUST-1 MOFs. SEM scans (left column; scale bars denote lengths of 50 μm), corresponding lateral size frequency distributions (from an analysis of approximately 100 crystals; center column), and, (powder XRD patterns (right column) of a bulk HKUST-1 synthesized under slow solvent evaporation as the control in the absence of acoustic excitation, and, b–e HKUST-1 MOFs synthesized under increasing input voltages (1.5, 4.5, 7.5, 9 Vrms, respectively). The Pawley fit (calc) to the experimental (obs) powder XRD data is shown in dark gray and the difference (diff) is shown in light gray, from which it can be seen that the observed XRD patterns matches that of crystal models that exhibit preferential orientation

