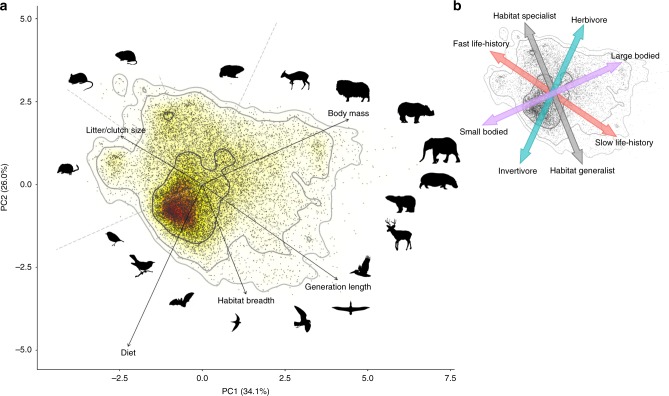
Fig. 1.
The ecological strategy surface for mammals and birds. a Projection of 15,484 living land mammal and bird species (dots) on the surface defined by principal component axes (PC) 1 and 2 (mean values across 25 imputed datasets; Supplementary Methods; Supplementary Fig. 2). Solid arrows indicate direction and weighting of vectors representing the five continuous traits analyzed (Supplementary Table 1 for loadings). Silhouettes show a selection of species characterizing the edges of strategy space (eight silhouettes were freely downloaded from PhyloPic www.phylopic.org, under CC0 1.0 Public Domain Dedication, while the rest were created in Inkscape by the authors; Supplementary Fig. 3 for species locations, scientific names and image sources). The color gradient indicates regions of highest (red) to lowest (white) occurrence probability of species across the ecological strategy surface, with contour lines indicating 0.5, 0.95, and 0.99 quantiles. Percentage values represent proportion of the total variation explained by each PC. To quantify diet, we extracted the dominant diet gradient across ten diet categories for all species, using a principal coordinates analysis (PCoA; Supplementary Fig. 4). b The ecological strategy surface is also illustrated with simplified gradients. Source data are provided as a Source Data file

