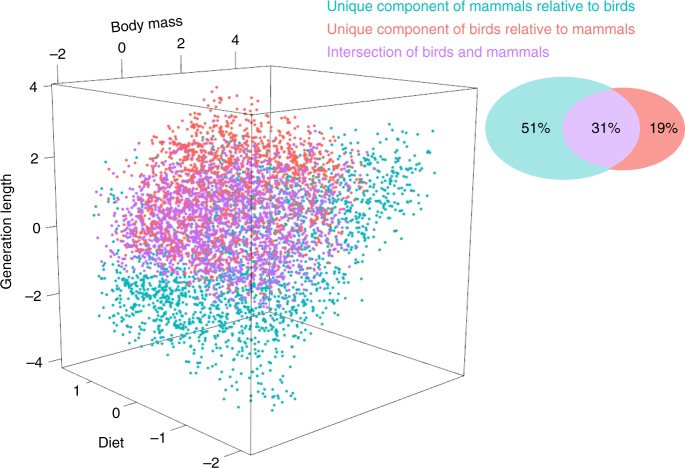
Fig. 2.
Overlap between mammal and bird ecological strategy spaces. The separation (unique components) and overlap (intersection) of 15,484 living land mammal and bird species across ecological strategy spaces (hypervolumes). The two ecological strategy spaces (one for mammals, one for birds) are constructed on the basis of the five z-transformed traits, although only the three traits with the highest loadings across the ecological strategy surface are used for visualization: log10(body mass), log10(generation length) and diet (Fig. 1a; Supplementary Table 1). The Venn diagram shows the percentage of the total combined volume occupied by each component (the percentages sum to 100 before rounding). Source data are provided as a Source Data file

