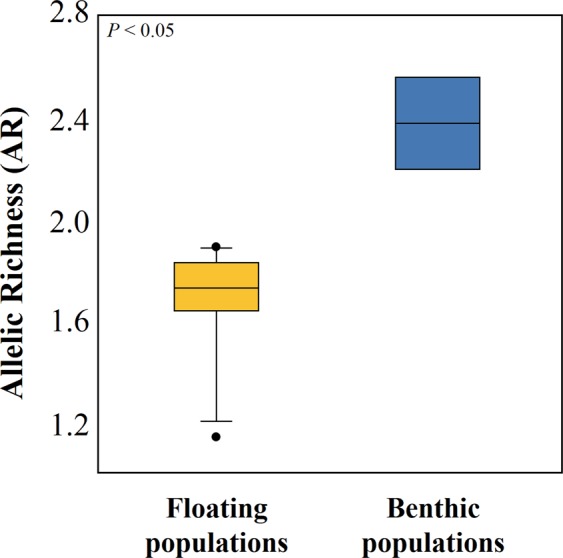
Figure 3.

A box plot illustrating a difference in the level of genetic diversity (allelic richness; AR) between floating (N = 11) and benthic (N = 4) populations. The level of AR was significantly higher for Korean benthic populations than for floating populations (Mann-Whitney U = 0.000, P = 0.004). The horizontal line within the box is the median, the upper and lower boundaries of the box mark the 25th and 75th percentiles and the whiskers mark the minimum and maximum values.
