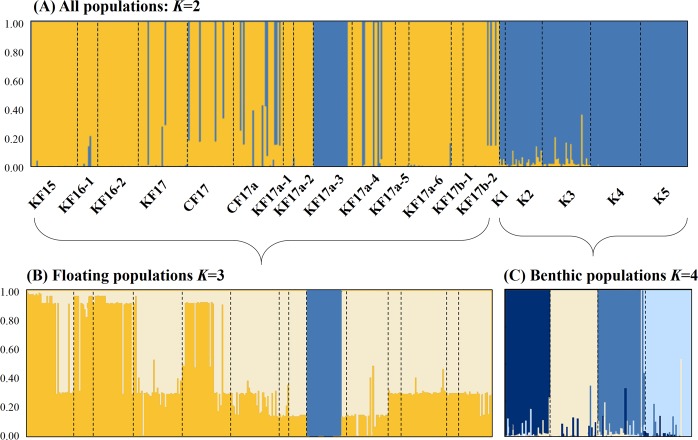
Figure 4.
Results of genetic structure using a Bayesian population assignment test with STRUCTURE for the study populations of Sargassum horneri, based on seven microsatellite markers. Each individual is represented along the X-axis, and the Y-axis denotes the probability of that individual belonging to each of the genetic clusters. (A) Analyses of population structure for the all 19 populations combined. The most likely number of genetic clusters after Delta K Evanno’s correction corresponds to K = 2. Yellow colour represents floating populations, and blue colour represents benthic populations including the floating population of KF17a-3. (B) Analyses of population structure only for the 14 floating populations. The most likely number of genetic clusters after Delta K Evanno’s correction corresponds to K = 3 but the alpha (α) value was not stabilized (when the KF17a-3 population excluded), because of the very similar genetic structure among the 13 floating populations. (C) Analyses of population structure for the five benthic populations. The most likely number of genetic clusters after Delta K Evanno’s correction corresponds to K = 4.

