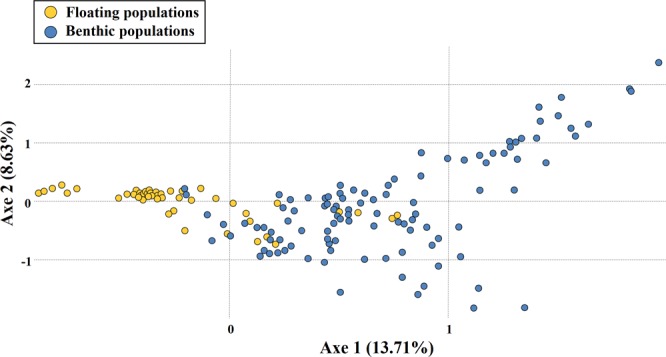
Figure 5.

Results of factorial correspondence analysis (FCA) showing multivariate relationships among the 19 populations of Sargassum horneri based on microsatellite allelic variation. Yellow circles represent 14 floating populations, and those in blue colour represent Korean benthic populations. Floating samples showing more close relationships with benthic genotypes (around the middle in the graph) are from the KF17a-3 population.
