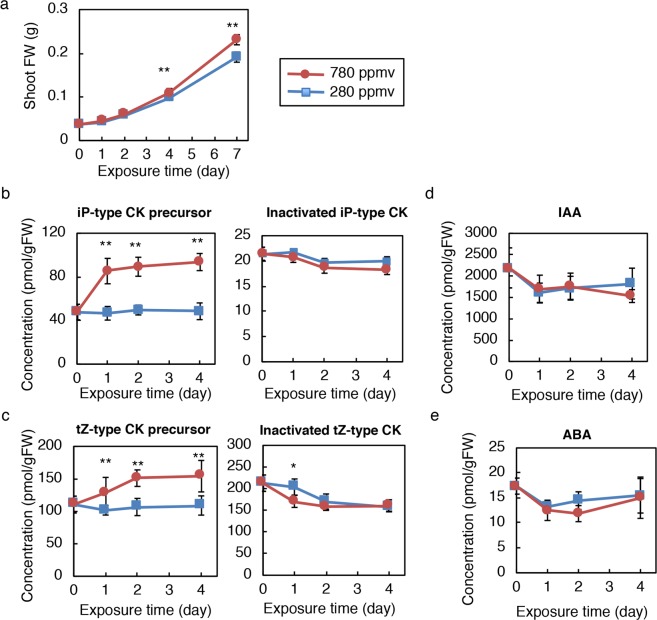
Figure 1.
Effects of high CO2 on growth and hormone concentrations in soil-grown plants. Shoot fresh weight (a), concentrations of iP-type cytokinin (CK) precursors and inactivated iP-type CKs (b), concentrations of tZ-type CK precursors and inactivated tZ-type CKs (c), IAA concentration (d), and ABA concentration (e) of Col-0 shoots incubated at 280 ppmv or 780 ppmv CO2 for the indicated periods. Error bars represent standard deviations (a, n = 10; b–e, n = 8). Asterisks indicate statistically significant differences between 280 ppmv CO2- and 780 ppmv CO2-treated samples at the same exposure time (*p < 0.05; **p < 0.01; Student’s t-test). FW, fresh weight; tZ, trans-zeatin; iP, N6-(∆2-isopentenyl)adenine; iP-type CK precursor, sum of iPR and iPRPs; inactivated iP-type CK, sum of iP7G and iP9G; tZ-type CK precursor, sum of tZR and tZRPs; inactivated tZ-type CK, sum of tZ7G, tZZ9G, tZOG, tZROG, and tZRPsOG. The concentrations of all quantified hormones are shown in Supplementary Table S1.

