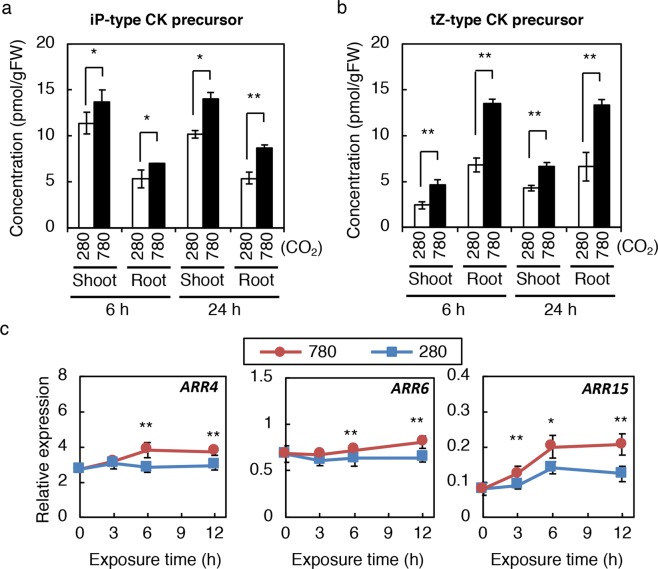
Figure 2.
Cytokinin levels and activity in seedlings exposed to high CO2. (a,b) Cytokinin (CK) levels in shoots and roots of Col-0 seedlings exposed to low and high CO2. iP-type CK precursor levels (a) and tZ-type CK precursor levels (b) in shoots and roots are presented. (c) Expression levels of type-A ARR genes in Col-0 seedlings exposed to low and high CO2. Transcript levels of ARR4, ARR6, and ARR15 were analysed by quantitative RT-PCR. Expression levels were normalized using At4g34270 as an internal control. Twelve-day-old seedlings grown on 1/2 MS agar plates at 280 ppmv were exposed to 280 ppmv (280) or 780 ppmv (780) CO2 for the indicated periods. Error bars represent standard deviations of three biological replicates. Asterisks indicate statistically significant differences between 280 ppmv CO2- and 780 ppmv CO2-treated samples at the same exposure time (*p < 0.05; **p < 0.01; Student’s t-test). FW, fresh weight; tZ, trans-zeatin; iP, N6-(∆2-isopentenyl)adenine. The concentrations of cytokinin molecular species are shown in Supplementary Table S2.

