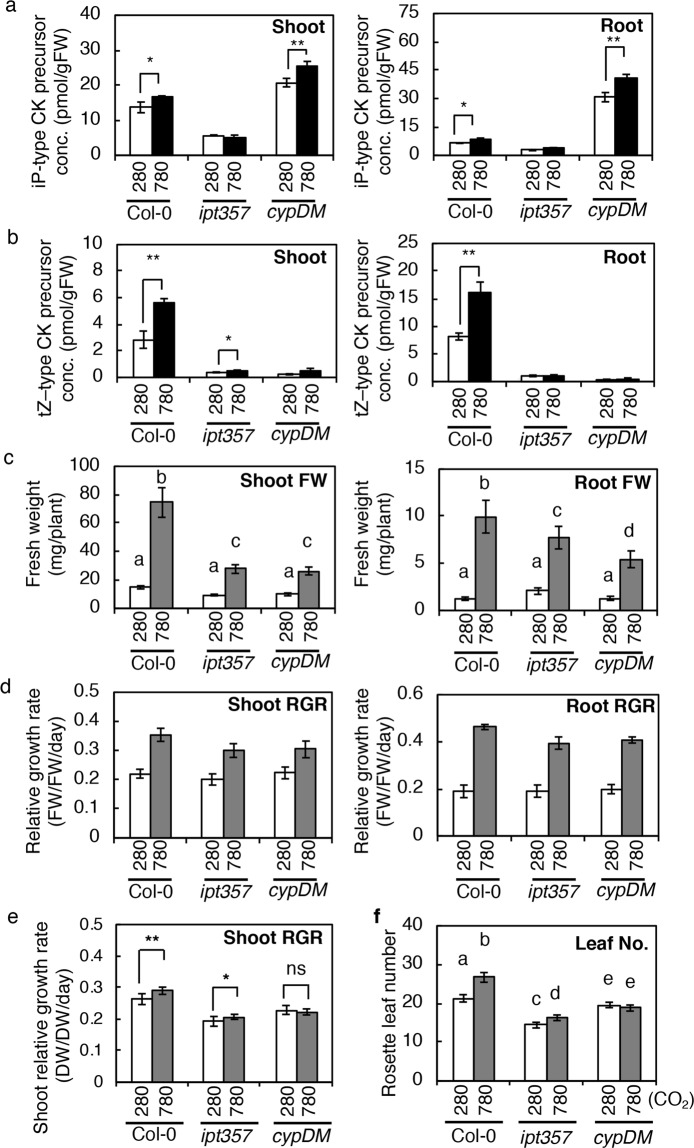
Figure 7.
Cytokinin levels and growth of wild-type, ipt3 ipt5 ipt7 and cyp735a1 cyp735a2 seedlings exposed to high CO2. (a,b) The concentration of iP-type cytokinin (CK) precursors (a) and tZ-type CK precursors (b) in shoots and roots of wild-type (Col-0), ipt3 ipt5 ipt7 (ipt357) and cyp735a1 cyp735a2 (cypDM) plants exposed to 280 ppmv (280) or 780 ppmv (780) CO2 for 24 h. Asterisks indicate statistically significant differences (**p < 0.01; *p < 0.05; Student’s t-test). The concentrations of cytokinin molecular species are shown in Supplementary Table S7. (c,d) Fresh-weight (c) and relative growth rate (RGR) (d) of 19-day-old wild type (Col-0), ipt3 ipt5 ipt7 (ipt357), and cyp735a1 cyp735a2 (cypDM) seedlings treated under 280 ppmv (280) or 780 ppmv (780) CO2 for seven days. (d) RGR was calculated using the fresh weight (FW) data obtained previously (Supplementary Fig. S5) and after (c) low or high CO2 treatment. (e,f) Shoot growth of soil-grown wild-type, ipt3 ipt5 ipt7 and cyp735a1 cyp735a2 plants under low or high CO2. (e) Relative growth rates (RGR) of shoots of Col-0, ipt357, and cypDM grown under 280 or 780 on soil. Dry weights of shoots shown in Supplementary Fig. 6b were used to calculate the RGR. Asterisks indicate statistically significant differences (**p < 0.001; *p < 0.01; not significant (ns), p > 0.01; two-way ANOVA). (f) Rosette leaf number of Col-0, ipt357, and cypDM counted at 31 DAG. Error bars represent standard deviations (a, n = 3; b, n = 3; c, n = 9; f, n = 10) and standard error (d, n = 9; e, n = 9). Lower-case letters denote statistically significant classes (Tukey’s HSD test, p < 0.05).

