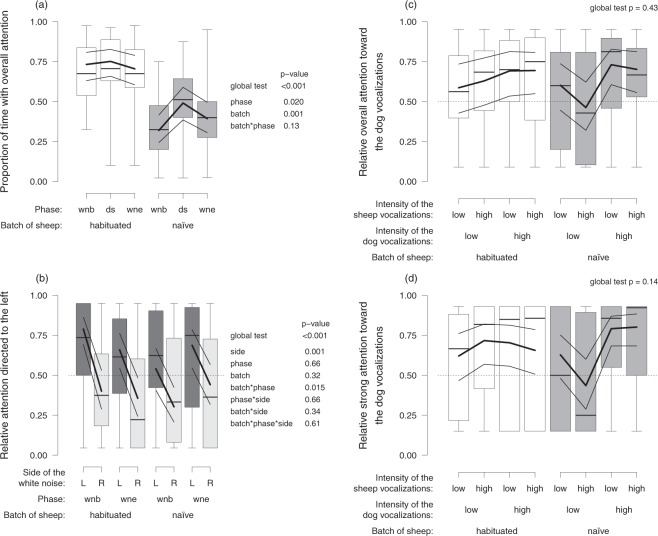
Figure 1.
Sheep pay attention toward acoustic stimuli. (a) Proportion of time with sheep’s overall attention during the different phases, i.e. toward the white noise (wnb beginning, wne end) and the dog/sheep vocalizations (ds) depending on the batch of sheep (habituated, naïve). (b) Relative attention directed to the left when the white noise was played from the left or right side (L, R) for each phase of the white noise presentation (wnb beginning, wne end) and the batch of sheep (habituated, naïve). (c) Relative overall attention and (d) relative strong attention directed toward the dog vocalizations depending on the intensity of the sheep and dog vocalizations (low, high) and the batch of sheep (habituated, naïve). Statistical information is given for each model. Boxplots indicate data range, median, as well as lower and upper quartiles. Thick black lines are the model estimates, and thin black lines are the 95% confidence intervals of the maximum model (including the main effects and interactions).

