Fig. 1.
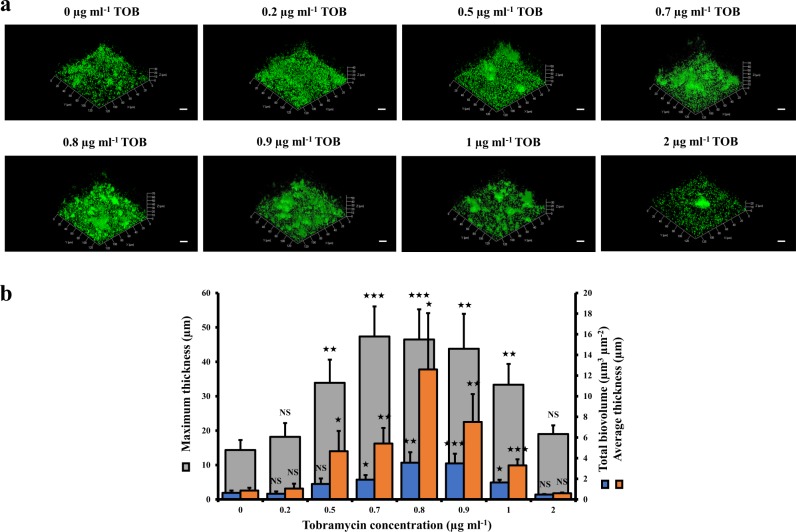
Effect of sub-MICs of tobramycin on biofilm formation by P. aeruginosa. a CLSM images of 24-h-old biofilms as a function of different concentrations of tobramycin. For each concentration, a 3D view along the x, y and z axes is displayed. Images show representative data from at least three independent biofilm assays. Scale bars = 20 µm. b COMSTAT image analyses were performed to determine maximum thicknesses (μm), average thicknesses (μm), and total biovolumes (μm3 μm−2). The error bars represent the standard error of the means (SEMs) and are the result of the analysis of three views of each of the three independent biological assays. Statistics were achieved by a two-tailed t test: ★★★, P = 0.0001 to 0.001; ★★, P = 0.001 to 0.01; ★, P = 0.01 to 0.05; NS (not significant), P ≥ 0.05

