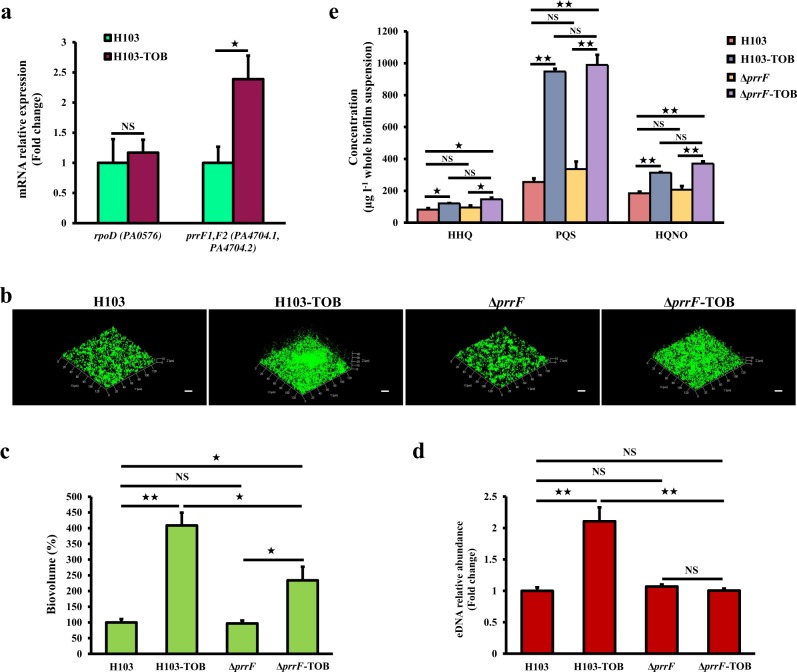
Fig. 5.
Role of PrrF1/F2 sRNAs in tobramycin-enhanced biofilm formation. a Relative prrF mRNA levels in P. aeruginosa biofilms exposed to tobramycin (brown bars) compared to the relative expression of mRNA levels in the control condition (green bars), after 24 h of growth. Quantifications have been obtained from at least three independent experiments and rpoD was used as a control housekeeping gene. Error bars represent standard error of the means (n = 3). b Representative CLSM 3D micrographs of 24-h-old biofilms P. aeruginosa H103 and ΔprrF mutant strains exposed to tobramycin (0.8 μg ml−1) compared to untreated biofilms. Scale bars = 20 µm. CLSM images were analyzed using COMSTAT software to quantify c biofilm biovolumes. Error bars represent standard error of the means (n = 3) and d eDNA relative abundances. eDNA values are normalized to biofilm biomass. Error bars represent standard error of the means (n = 3). e HAQs levels of the ΔprrF mutant and its isogenic parent strain H103 grown with or without tobramycin supplementation, as determined by LC-MS/MS. Error bars represent standard error of the means (n = 3). Statistics were achieved by a two-tailed t test: ★★, P = 0.001 to 0.01; ★, P = 0.01 to 0.05; NS (not significant), P ≥ 0.05

