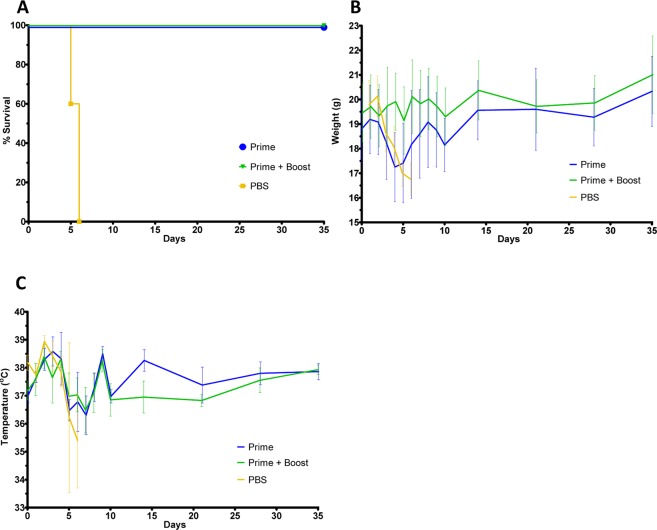
Figure 4.
In vivo experimental data: animal survival, average weights, average temperatures, and clinical scoring. (A) Kaplan-Meier survival curve of challenged animal groups. Group is indicated by color which corresponds to the colored triangles outlined in Fig. 3. (B) Averaged weights with error bars from all groups collected each day for 14 days post challenge and every 7 days after that for 35 days post challenge total. (C) Averaged temperature with error bars from all groups collected each day for 14 days post challenge and every 7 days after that for 35 days post challenge total.

