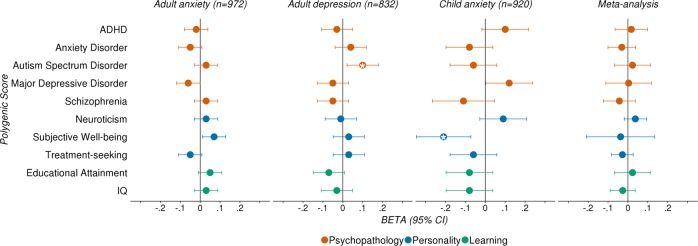
Fig. 2. Associations between polygenic scores (reflecting genetic propensity for psychopathology, personality, and learning) and therapy outcomes.
Beta coefficients and 95% confidence intervals (error bars) from univariable linear regressions examining the relationship between treatment outcome and each polygenic score, in each of the meta-analysis cohorts, and subsequent meta-analysis; P-value thresholds selected in these analyses are detailed in Supplementary Table 6; asterisk (*) indicates empirical p-value < 0.05, after 10,000 permutations

