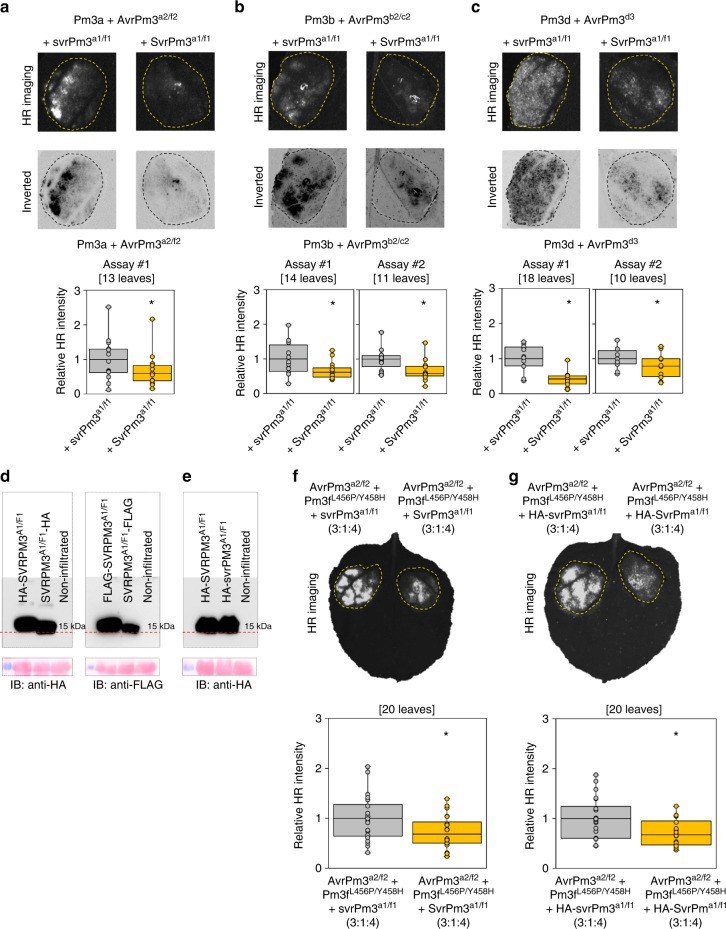
Fig. 3.
Suppression of AvrPm3-Pm3 recognition by SvrPm3a1/f1. a-c Suppression of the recognition of AvrPm3a2/f2 (a), AvrPm3b2/c2 (b) and AvrPm3d3 (c) in presence of the active allele of the SvrPm3a1/f1 suppressor (right spot). Ratios of Avr-R-Svr mixes for AvrPm3a2/f2, AvrPm3b2/c2 and AvrPm3d3 were 3:1:4, 4:1:4, and 2:1:4 respectively. HR is compared to a negative control in presence of the inactive suppressor allele svrPm3a1/f1 (left spot). Results are consistent over at least two independent assays each consisting of at least 10 independent leaf replicates. HR quantification in presence of the inactive vs. active suppressor is depicted in the lower panels. Number of independent leaf replicates is indicated. Complete N. benthamiana leaf pictures are provided in Source Data File. d Western blot detection of C and N terminal HA and FLAG epitope fusions of the active SVRPM3A1/F1 and Ponceau staining of the membrane (lower panel) are depicted. e Western blot detection HA-SVRPM3A1/F1 and HA-svrPM3A1/F1 suppressors demonstrating there is no difference in protein abundance between active vs. inactive alleles, respectively. Uncropped Western blot images are provided in Source Data File. f,g Functionality of tagged HA-svrPm3a1/f1 and HA-SvrPm3a1/f1 (g) compared to non-tagged svrPm3a1/f1 and SvrPm3a1/f1 (f). HR is induced by combining AvrPm3a2/f2 and Pm3f L456P/Y458H. Suppression is assessed by comparing active vs. inactive suppressors, as originally described in Bourras et al.28. Avr-R-Svr ratios are indicated. HR was measured using HSR imaging 3 days post N. benthamiana agro-infiltration (f-g, upper panel). HR Quantification from the same assays revealed by HSR imaging (f-g lower panels). In both cases, the presence of the active suppressor allele (SvrPm3a1/f1) resulted in significant reduction of HR as compared to the inactive alleles (svrPm3a1/f1) independently of the epitope, demonstrating that HA-svrPm3a1/f1 and HA-SvrPm3a1/f1 are functional. Number of independent leaf replicates is indicated. Statistical significance in a-c, f, g was assessed with a two-sided Student t-Test for paired data and indicated with (*; p < 0.05). Mean values are indicated by the middle line in the boxplot. Individual data points are plotted along the whiskers delineating minimum and maximum values. Raw data underlying the reported averages in a-c, f, g are provided in a Source Data File

