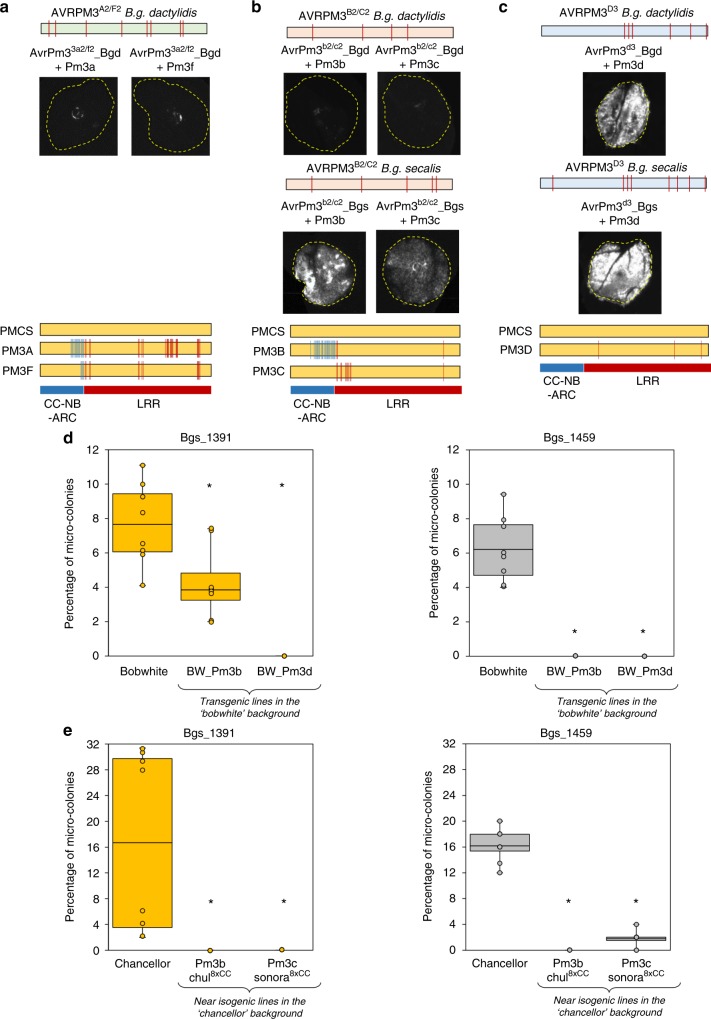
Fig. 6.
Conservation of AvrPm3-Pm3 recognition in grass mildews a–c Transient expression assays combining the identified grass mildew homologues of AVRPM3A2/F2 (a), AVRPM3B2/C2 (b), and AVRPM3D3 (c), with their corresponding PM3 NLR receptors. Results are consistent over at least two independent assays each consisting of 6–8 independent leaf replicates. Complete N. benthamiana leaf pictures are provided in a Source Data File. Polymorphic residues compared to the B.g. tritici encoded sequences are schematically indicated with vertical bars. Similarly, polymorphic residues in the PM3 protein variants compared to the susceptible PM3CS sequence are indicated with vertical blue (CC-NB-ARC) and red (LRR) lines in the lower panel. d, e Percentage of micro-colonies formed by the non-adapted B.g. secalis isolates Bgs_1391 and Bgs_1459 on d transgenic lines expressing the Pm3b (BW_PM3b) and Pm3d (BW_Pm3d) resistance genes in the hexaploid wheat genotype ‘Bobwhite’, compared to the non-transgenic ‘Bobwhite’ control, e Near isogenic lines (NILs) expressing the Pm3b (Chul8xCC) and Pm3c (Sonora8xCC) resistance loci backcrossed 8 times with the hexaploid wheat genotype ‘Chancellor’, compared to a ‘Chancellor’ control. Both ‘Bobwhite and ‘Chancellor’ are fully susceptible to adapted B.g. tritici races. Micro-colony formation was scored microscopically 2 days post rye mildew infection (see Methods). Values are representative of the average from eight independent leaf replicates. Mean values are indicated by the middle line in the boxplot. Individual data points are plotted along the whiskers delineating minimum and maximum values. Differences to the control were statistically tested with the Wilcoxon Rank Sum Test. Statistical significance (p < 0.05) is indicated with a star. Raw data underlying the reported averages are provided in a Source Data File

