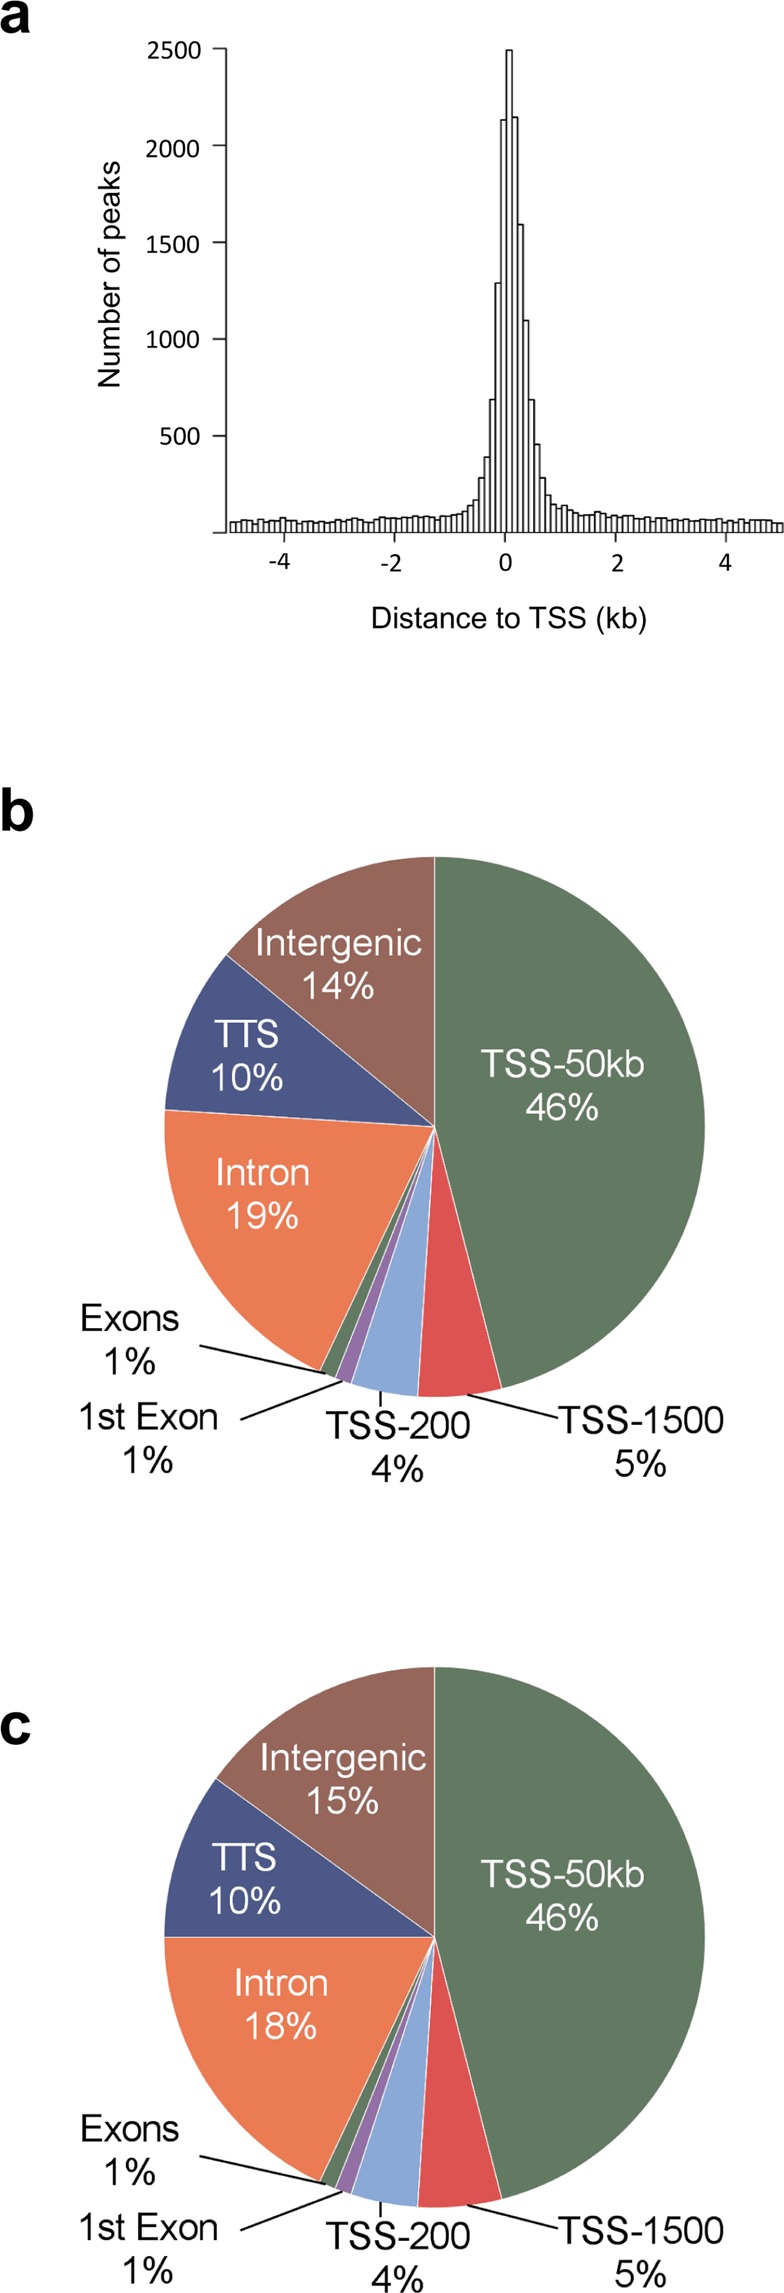
Figure 2.

(a) Histogram showing the distance from the nearest transcription start site (TSS) for all islet ATAC-seq peaks. (b-c) Proportions of islet ATAC-seq peaks annotated to different genomic regions in (b) non-diabetic donors and (c) donors with type 2 diabetes. Here, TSS-50 kb represents 1,501–50,000 bp upstream of the TSS, TSS-1500 represents 201–1,500 bp upstream of the TSS, TSS-200 represents 1–200 bp upstream of the TSS, and TTS represents 1–10,000 bp downstream of the transcript termination site.
