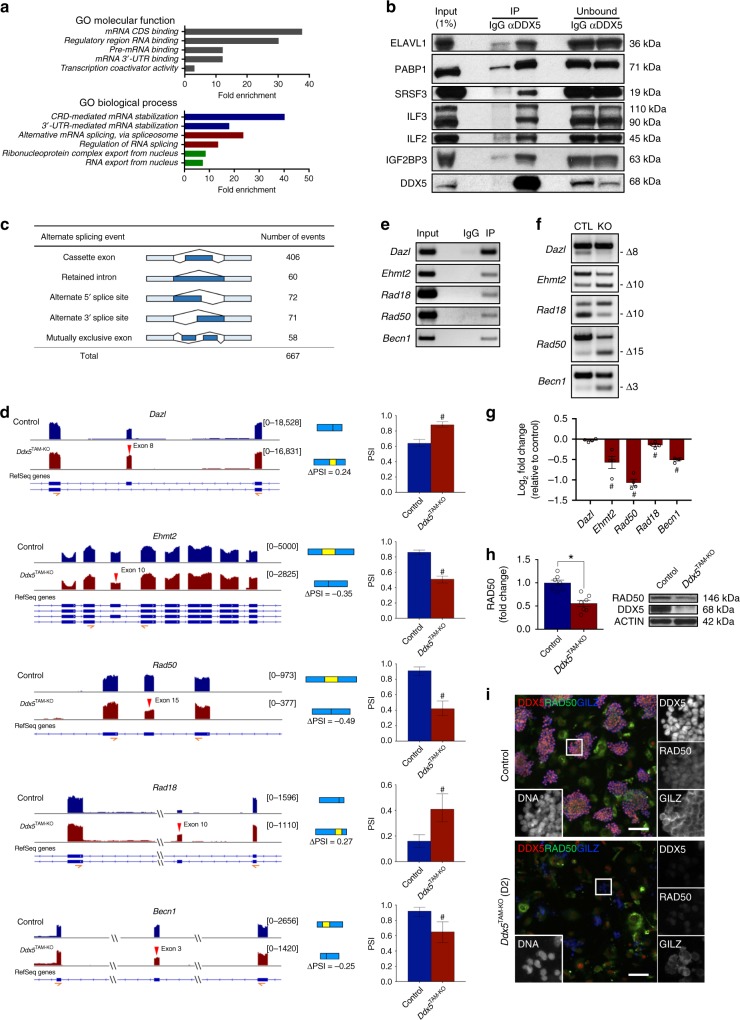
Fig. 4.
DDX5 is an essential regulator of splicing in undifferentiated spermatogonia. a Gene ontology (GO) term enrichment analysis of data obtained from DDX5 immunoprecipitation followed by mass spectrometry using wildtype murine cultured undifferentiated spermatogonia (n = 3 independent experiments). b DDX5 immunoprecipitation followed by western blot in wildtype cultured spermatogonia confirming the interaction of DDX5 with proteins involved in pre-mRNA splicing (SRSF3), maintenance of mRNA stability (ELAVL1, PABP1, ILF3, ILF2, IGF2BP3), mRNA export (PABP1, SRSF3, ILF2, ILF3, IGF2BP3) and translation (IGF2BP3). Representative of n = 2 independent experiments. c Summary of differential splicing analysis performed between control and Ddx5-ablated cultured spermatogonia. Numbers of predicted alternative splicing events in each category upon Ddx5 deletion are indicated. d Visualisation of differential splicing analysis of RNA-sequencing data comparing control and Ddx5-ablated spermatogonia. Tracks are shown for selected candidate genes (left). Red arrows indicate differentially spliced exon. Schematics of alternative splicing events are shown (blue and yellow rectangles) (middle). Change in “percent spliced in” between conditions is shown as a value below splicing schematics (ΔPSI) and in bar charts (right). #: changes meet analysis cut-offs (ΔPSI >0.20, Bayes Factor ≥10). PSI ± 95% confidence interval shown. e RNA-immunoprecipitation using DDX5 antibody in cultured wildtype spermatogonia followed by PCR and gel electrophoresis for differentially spliced candidates depicted in d. Representative of n = 3 independent samples per condition. f PCR validation of differentially spliced candidates identified in d. CTL vehicle-treated control spermatogonia, KO Ddx5-ablated cultured spermatogonia. Differentially spliced exons are depicted by “Δexon number”. Representative of n = 3 independent samples. Position of the PCR primers used are depicted in d in orange beneath schematic showing gene structure. g Bar chart of RNA-sequencing analysis for selected candidates. Fold change in Ddx5-ablated spermatogonia relative to vehicle-treated control. # denotes FDR <0.05. Mean ± SEM shown; n = 4 independent biological replicates per condition. h RAD50 protein levels by western blot in vehicle-treated control (Control) versus Ddx5-ablated cultured spermatogonia (Ddx5TAM-KO). *P < 0.05; two-tailed unpaired t-test; mean ± SEM shown; n = 4 independent biological replicates per condition. Representative western blot shown on right. i RAD50 immunofluorescence of vehicle-treated control (top) and Ddx5-ablated (bottom) cultured spermatogonia at D2 post-treatment. Representative of n = 4 independent biological replicates per condition. Scale bars = 100 μm

