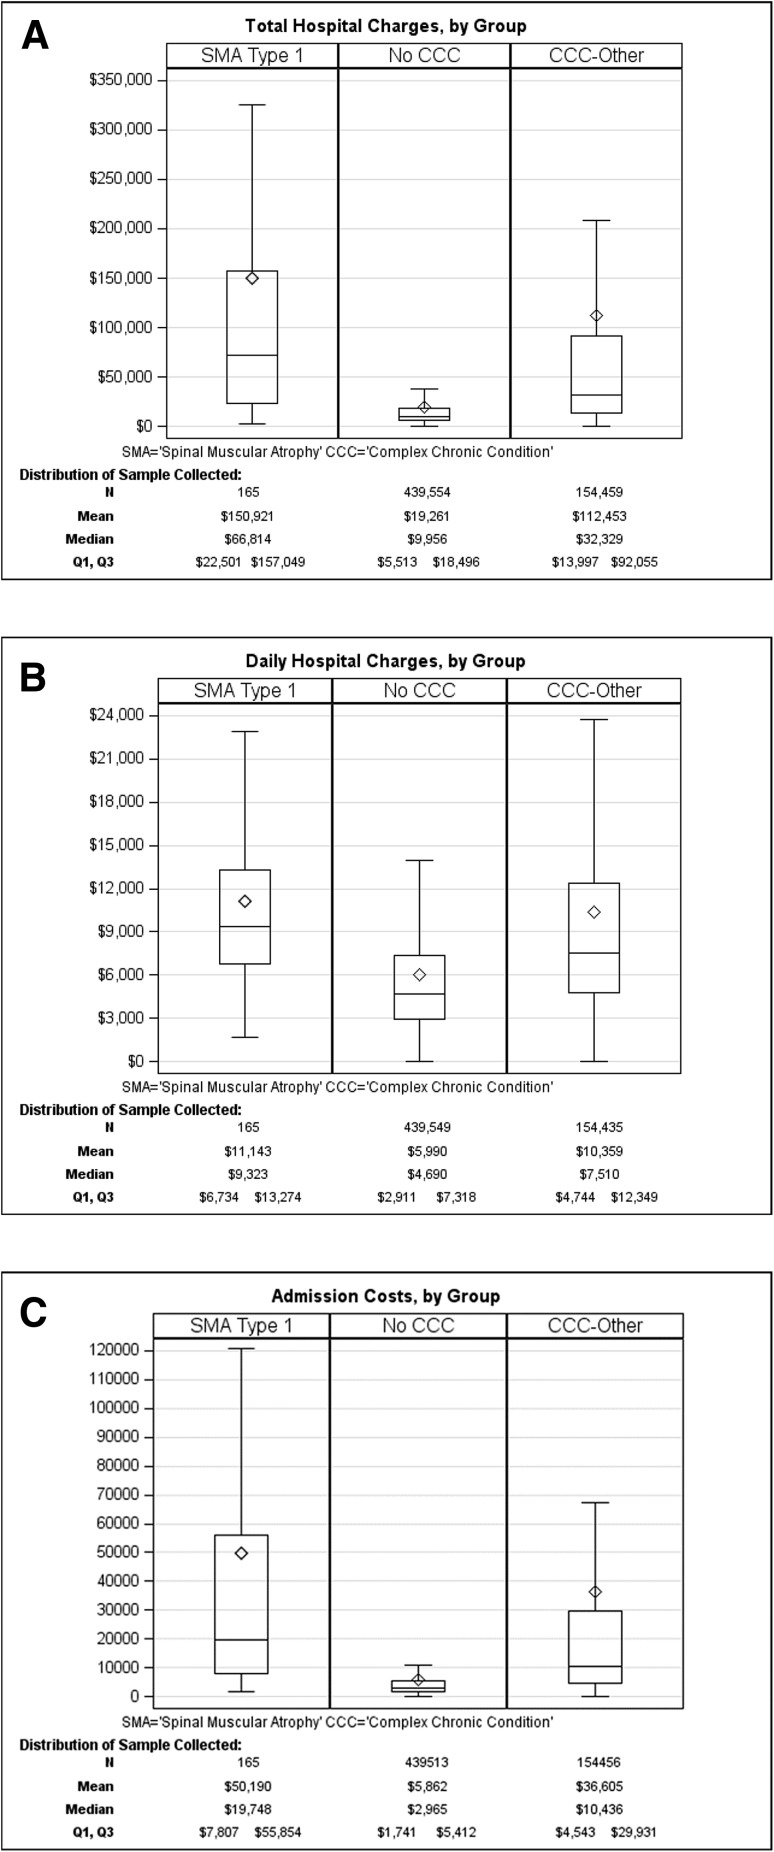
Fig. 1.
Total (a) and daily (b) hospital charges and (c) total costs per admission for patients with type 1 spinal muscular atrophy (SMA1), no complex chronic conditions (CCC), or other CCC. Box indicates interquartile range, diamond indicates mean values, line within the box indicates median values. Outliers are omitted from the figure

