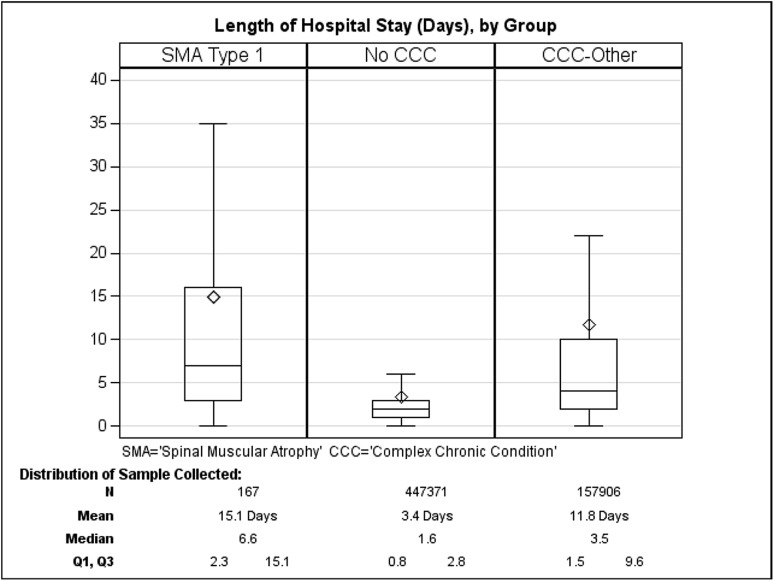
Fig. 2.
Length of hospital stay per admission for patients with type 1 spinal muscular atrophy (SMA1), no complex chronic conditions (CCC), or other CCC. Box indicates interquartile range (Q3–Q1); diamond indicates mean values; line within the box indicates median values. Outliers are omitted from the figure

