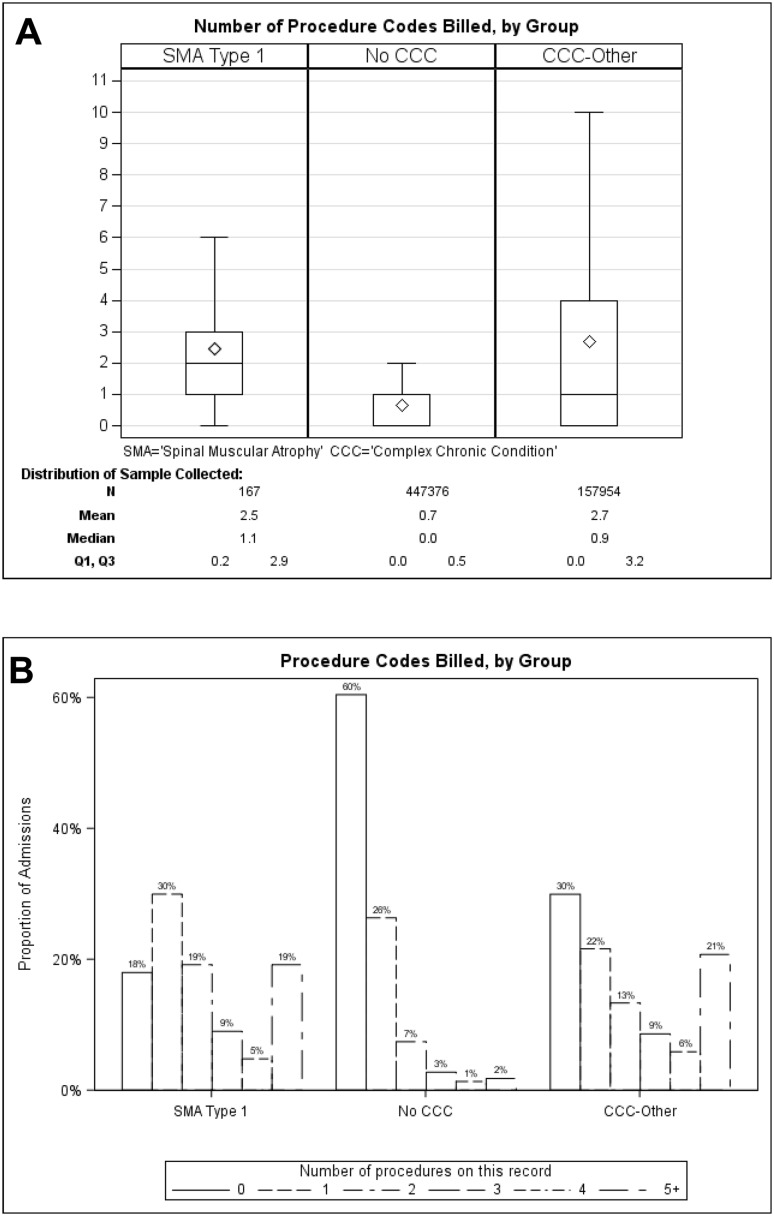
Fig. 3.
Number of procedure codes billed per admission (a) and proportion of patients in each group with 0, 1, 2, 3, 4, or ≥ 5 procedure codes billed per admission (b). Box indicates interquartile range (Q3–Q1); diamond indicates mean values; line within the box indicates median values. Outliers are omitted from the figure

