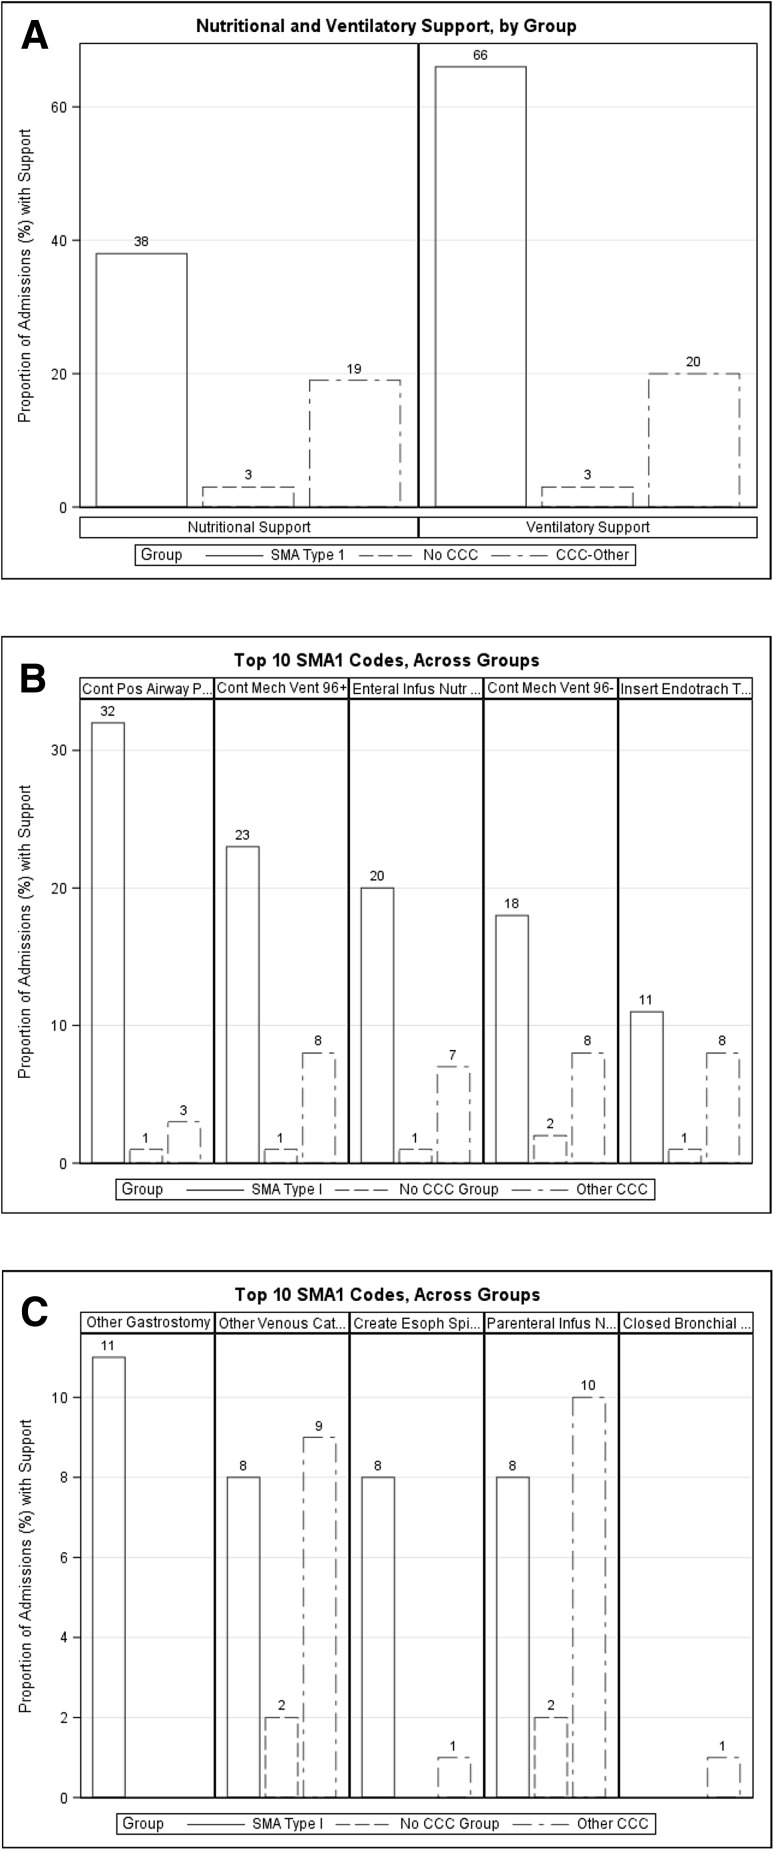
Fig. 4.
The proportion of admissions including procedure codes for nutritional and ventilatory support (a) and proportion of admissions involving each of the top ten billed procedures for type 1 spinal muscular atrophy (SMA1), presented for each group (SMA1, no complex chronic conditions [CCC], and other CCC) (b, c)

