
Fig. 4.
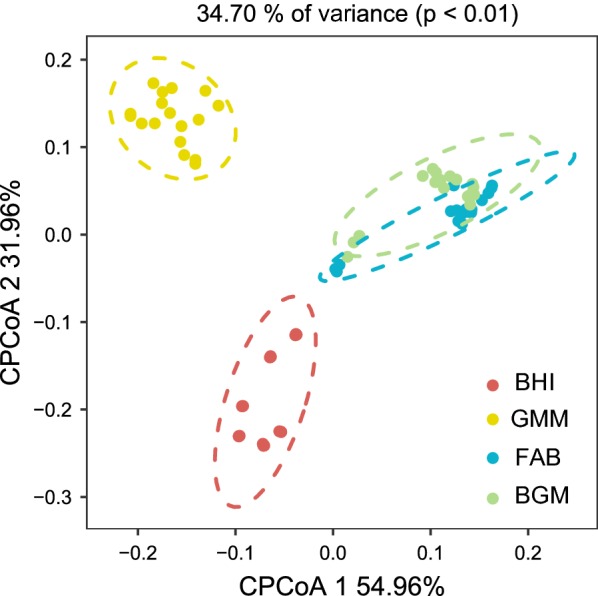
Constrained PCoA plot of Bray–Curtis distances of the BHI, GMM, FAB and BGM groups constrained by group (34.70% of variance explained, p < 0.01) from 4 to 48 h
Official websites use .gov
A
.gov website belongs to an official
government organization in the United States.
Secure .gov websites use HTTPS
A lock (
) or https:// means you've safely
connected to the .gov website. Share sensitive
information only on official, secure websites.
Constrained PCoA plot of Bray–Curtis distances of the BHI, GMM, FAB and BGM groups constrained by group (34.70% of variance explained, p < 0.01) from 4 to 48 h