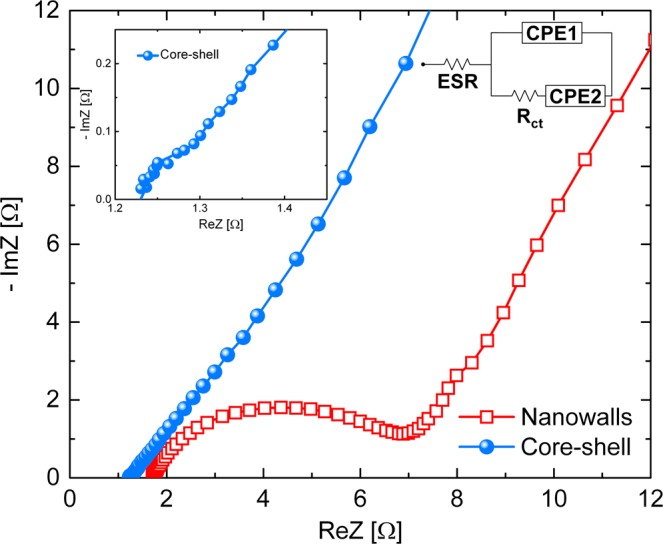
Figure 9.

Nyquist plot of the nanowalls (red open squares) and core-shell (blue spheres) samples recorded at 0 V vs open circuit potential with a 5 mV superimposed AC voltage in the frequency range 104 ÷ 10−2 Hz in 1 M KOH solution (the inset is the magnified high-frequency region of the core-shell electrode). Equivalent circuit model for the Nyquist plots is also reported: an equivalent series resistance (ESR) is connected in series with a constant phase element (CPE1) in parallel with the charge transfer resistance (Rct) and a constant phase element (CPE2)14.
