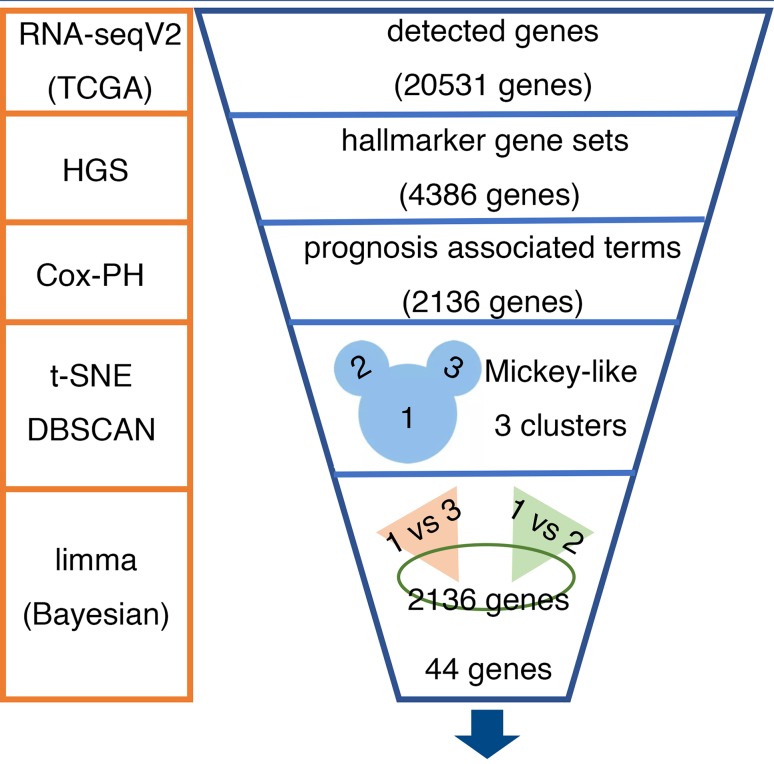
Fig. 1.
Pipeline for identifying the 44 predominant P-DEGs. RNA-seqV2 (TCGA): mRNA expression datasets from The Cancer Genome Atlas (TCGA). HGS: The hallmark-GSVA enrichment score was calculated using hallmark gene sets with the gene set variation analysis algorithm. Cox-PH: Cox’s proportional hazards regression model. t-SNE: t-distributed stochastic neighbor embedding. DBSCAN: density-based spatial clustering of applications with noise. limma (Bayesian): the R package ‘limma’ was used with the empirical Bayesian model to identify the differentially expressed genes

