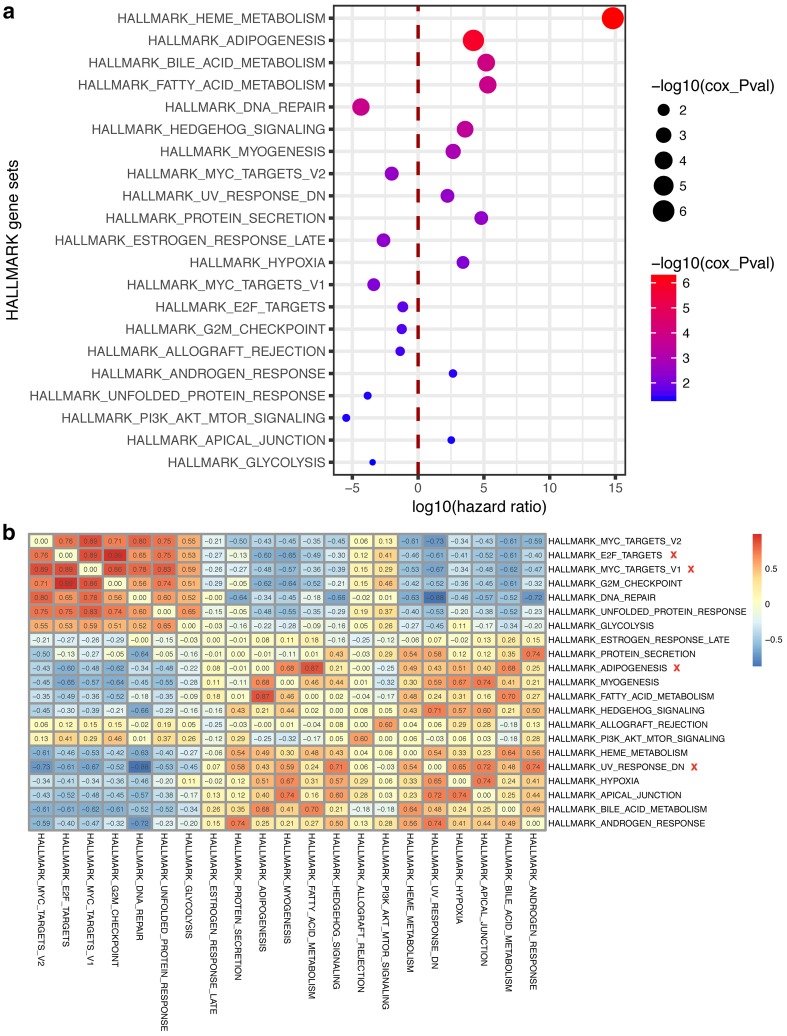
Fig. 2.
Hallmark-GSVA score (HGS) and prognosis. a Twenty-one prognosis-associated hallmark gene sets and their hazard ratios. The hazard ratios were logarithmically transformed; that is, the transformed ratios of less than zero correspond to protective factors, and ratios of more than zero correspond to risk factors (abscissa). The red dashed line divides the protective and risk factors. The hallmark gene sets are shown based on ascending order of p values. The diameter or color of the circle depicts the p value. b Correlation among each hallmark gene set. The removed hallmark terms are marked with a red ‘x’

