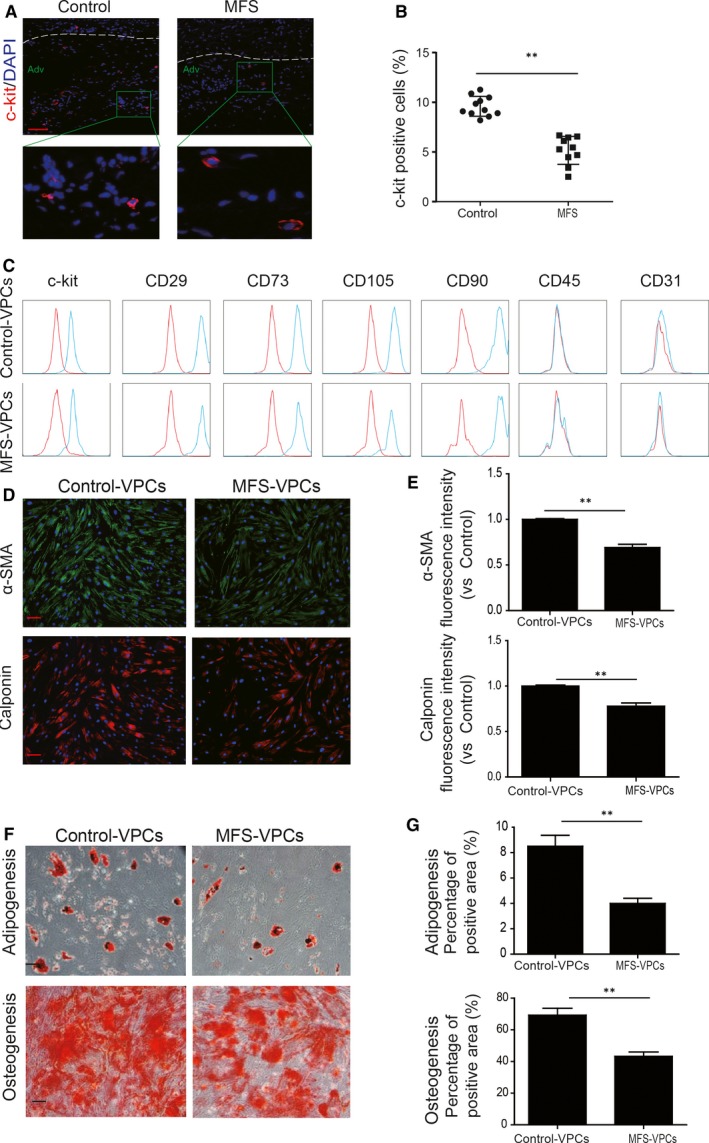
Figure 1.

Characterization of vascular progenitor cells (VPCs). A, Representative images of c‐kit staining in the adventitia of aorta from control and Marfan syndrome (MFS) donors. B, The c‐kit positive cells in the adventitia of the aorta from control and MFS donors were calculated and are presented as a percentage of total cells. C, Surface marker profiling determined by fluorescence‐activated cell sorting (FACS) in VPCs. that is, positive for c‐kit, CD29, CD73, CD90, CD105; negative for CD31, CD45. D, Representative images of α‐SMA and Calponin staining showing VPCs differentiated into smooth muscle cells. F, The differentiation capacities of adipogenesis and osteogenesis of VPCs in vitro were determined by Oil red staining and Alizarin red staining respectively. E, Quantitative analysis of fluorescence intensity of α‐SMA and Calponin in control‐VPCs and MFS‐VPCs after differentiation. G, Quantification of the area occupied by the oil red O staining and Alizarin red staining in control‐VPCs and MFS‐VPCs after differentiation. Data are expressed as mean ± SEM. **P < 0.01. Scale bar = 100 μm
