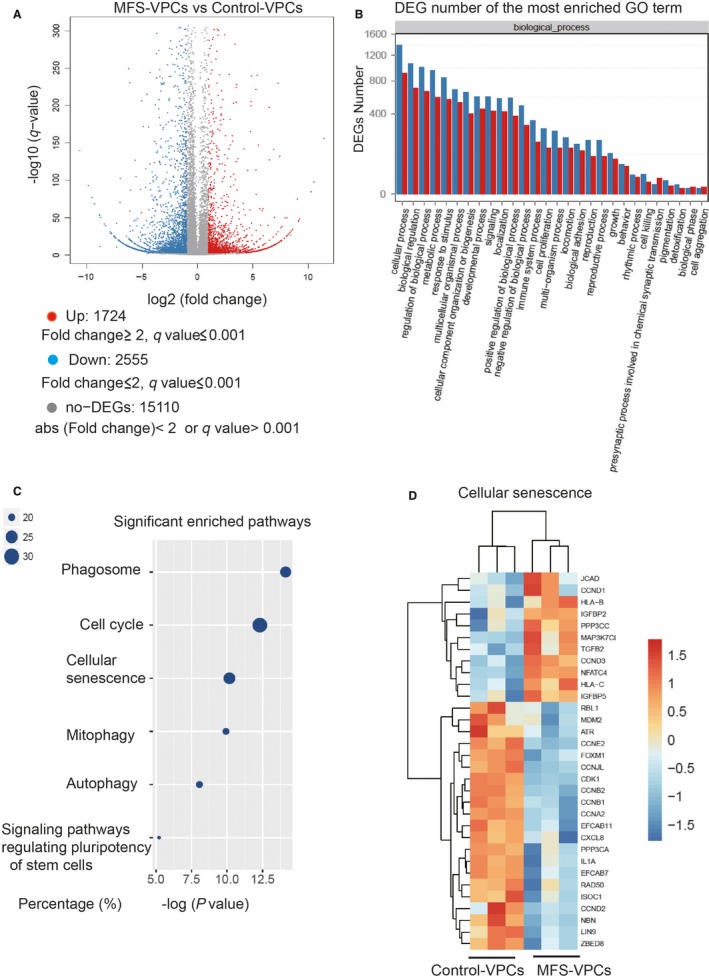
Figure 3.

Gene expression profile analysis of control‐vascular progenitor cells (VPCs) and Marfan syndrome (MFS)‐VPCs. A, Volcano plot showing the number of up‐regulated and down‐regulated genes in MFS‐VPCs compared with control‐VPCs. B, Differentially expressed genes (DEGs) number of the most enriched gene ontology (GO) term. C, GO enrichment analysis showing significantly enriched cellular process‐related pathways. It showed the x‐axis is the −log (P‐value), the size of the points corresponds to the percentage of the number of significant DEGs and the number of all the sequenced genes involved in the particular pathway. The larger the point is, the more genes in that pathway are involved in the MFS pathological process. D, Heatmaps showing the transcriptional level of genes enriched in cellular senescence
