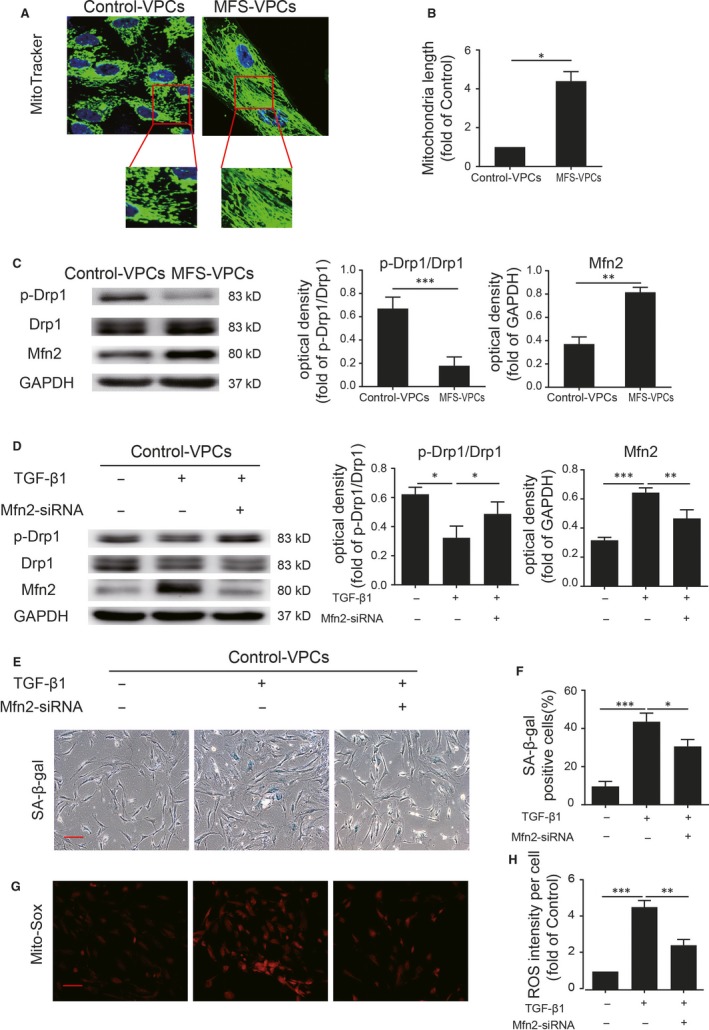
Figure 6.

TGF‐β1 induces mitochondrial fusion in vascular progenitor cells (VPCs). A, Representative images of mitochondrial morphology determined by MitoTracker staining in control‐VPCs and Marfan syndrome (MFS)‐VPCs. B, The mitochondrial length in control‐VPCs and MFS‐VPCs was analysed. C, Western blotting and quantitative analysis of the level of p‐Drp1 and Mfn2 protein in control‐VPCs and MFS‐VPCs. D, Western blotting and quantitative analysis of the level of p‐Drp1 and Mfn2 protein in control‐VPCs that received TGF‐β1 or TGF‐β1 + Mfn2‐siRNA treatment. E, Representative images of SA‐β‐gal staining in control‐VPCs that received TGF‐β1 or TGF‐β1 + Mfn2‐siRNA treatment. F, The SA‐β‐gal positive cells in control‐VPCs that received TGF‐β1 or TGF‐β1 + Mfn2‐siRNA treatment were calculated and are presented as a percentage of total cells. G, Representative images of Mito‐Sox staining in control‐VPCs that received TGF‐β1 or TGF‐β1 + Mfn2‐siRNA treatment. H, Quantitative analysis of ROS generation in control‐VPCs that received TGF‐β1 or TGF‐β1 + Mfn2‐siRNA treatment. Data are expressed as mean ± SEM (n = 3). *P < 0.05, **P < 0.01, ***P < 0.001. Scale bar = 100 μm
