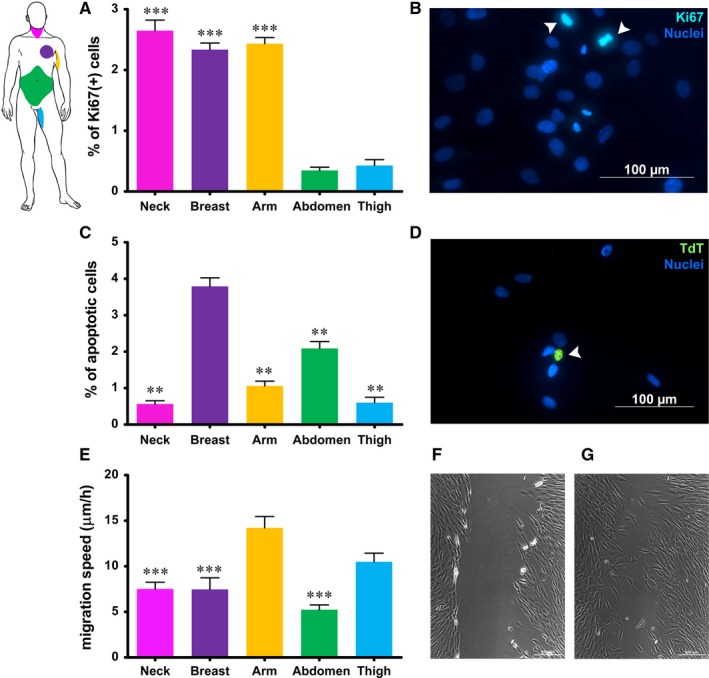
Figure 2.

Quantification of proliferation index (A), apoptotic rate (C) and speed of migration (E) of fibroblasts from different anatomic sites, measured by expression of Ki67, TUNEL assay and scratch wound assay respectively. B, representative image of ki‐67‐positive cells in fibroblast culture (arrowheads); D: representative image of an apoptotic cell in fibroblast culture (arrowhead); (F) and (G) representative images of scratch wound assay of fibroblasts in culture at time 0 and after 12 h. Each value in graphs expresses the mean + SE of fibroblasts obtained from five different patients for each region (n = 5). Asterisks are indicators of the P value as follows: (A) extremely significant (***P ≤ 0.001) vs fibroblasts from abdomen and thigh; (C) **very significant (**P ≤ 0.01) vs fibroblasts from breast; (E) ***extremely significant (***P ≤ 0.001) vs fibroblasts from arm. (B) and (D) Scale bar length is 100 µm; (F) and (G) Scale bar length is 200 µm. At the upper left corner a scheme of anatomic sites of origin of fibroblasts is reported for quick reference
