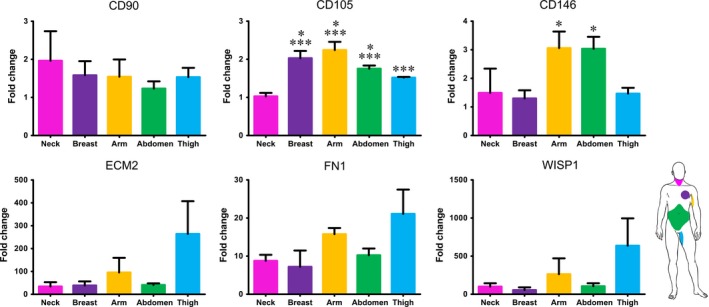
Figure 4.

Real‐time PCR analysis of the expression of genes characteristic of mesenchymal cells. Each value expresses the mean of five samples for each region (n = 5) + SE. Asterisks are indicators of the P value as follows: CD105: significant (*P ≤ 0.05) vs fibroblasts from thigh and extremely significant (***P ≤ 0.001) vs fibroblasts from abdomen; significant (* P ≤ 0.05) vs fibroblasts from breast and thigh. WISP1, WNT1 inducible signaling pathway protein 1; FN1, Fibronectin 1; ECM2, Extracellular Matrix Protein 2.
