
Figure 5.
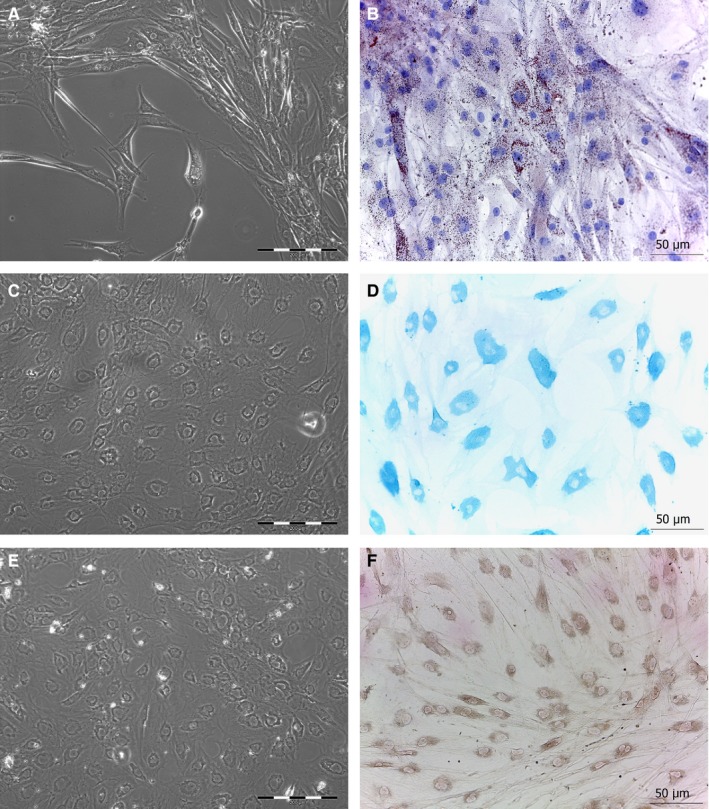
Following induction of adipogenic, chondrogenic and osteogenic differentiation, fibroblasts exhibited a dramatic change of phenotype as shown by representative images at phase‐contrast microscope (A, C, E). Specific stainings to identify intracellular lipid accumulation (Oil red O), sulfated glucose‐aminoglycan (Alcian blue) or calcium deposits (Von Kossa) confirmed the differentiation towards adipocytes (B), chondrocytes (D) and osteoblasts (F) respectively. Scale bar length is 200 µm for phase‐contrast images and 50 µm for brightfield images