
Figure 7.
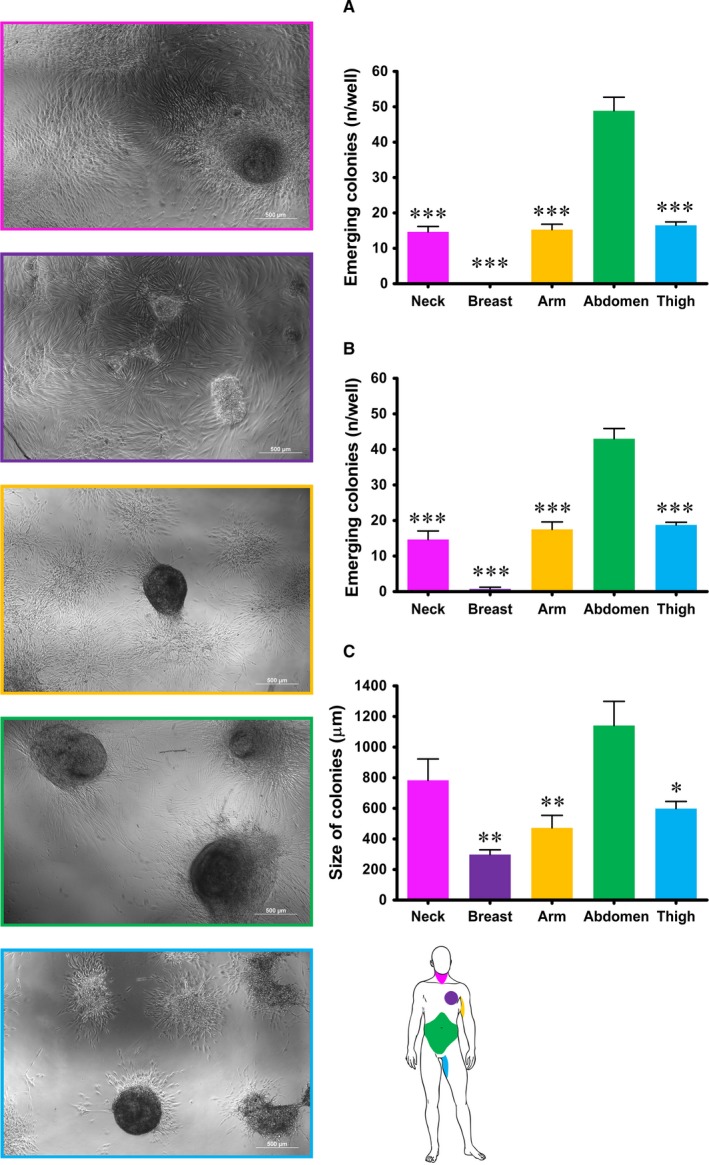
Reprogrammed human dermal fibroblast by mRNA direct delivery. On the left: representative images of colonies of induced pluripotent stem cells formed by fibroblasts from all five different anatomic sites at day 14 after transfection. On the right: (A) and (B) quantification of colonies formed by fibroblasts from the five different anatomic regions at day 7 (A) and 14 (B) after transfection. Each value expresses the mean ± SE (n = 4) and the three asterisks are indicators of the P value as extremely significant (*** P ≤ 0.001) vs fibroblasts from the abdominal skin. C, measurement of the size of colonies, expressed as the maximum diameter in μm, formed by fibroblasts from the five different anatomic regions at day 14 after transfection. Each value expresses the mean ± SE (n = 4) and asterisks are indicators of the P value as follows: significant (*P ≤ 0.05), very significant (**P ≤ 0.01) vs fibroblasts from the abdominal skin. At the bottom of the right side of the picture a scheme of anatomic sites of origin of fibroblasts is reported for quick reference