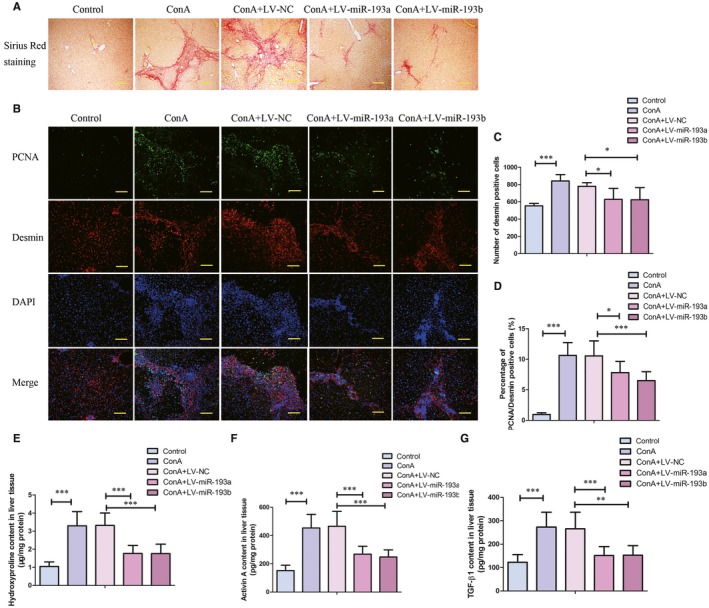
Figure 3.

Effect of miR‐193a/b‐3p overexpression on Concanavalin A (ConA)‐induced liver fibrosis. A, Collagen formation in liver tissues was evaluated by Sirius red staining (100×). Scale bar is 200 μm. B, Expressions of desmin and proliferating cell nuclear antigen (PCNA) in liver tissues were determined by immunofluorescence staining (200×). Scale bar is 100 μm. Quantitative analyses of number of desmin positive cells (C) and percentage of PCNA/desmin positive cells (D) were shown. The contents of Hydroxyproline, activin A, and TGF β1 in liver tissues were detected by commercial kits. All data were expressed as mean ± SD (n = 8). *P < 0.05, **P < 0.01, ***P < 0.001 vs the indicated group
