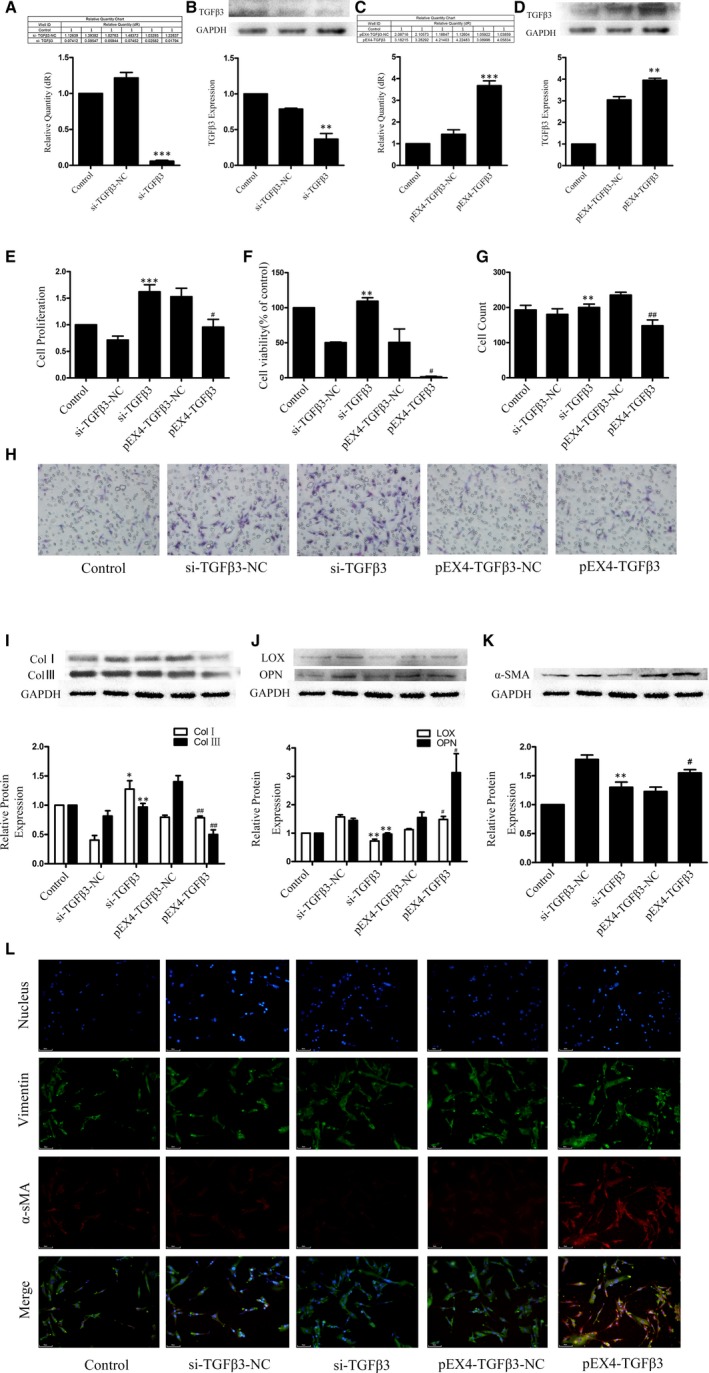
Figure 3.

A, B, The transfection efficiency of TGFβ3 siRNA was confirmed by RT‐qPCR, Western blot assays and semiquantitative analyses. The results are shown using GAPDH as an endogenous control. The data are presented as the mean ± SEM. **P < 0.01 versus the si‐TGFβ3‐NC group; ***P < 0.005 versus the si‐TGFβ3‐NC group; C, D, The transfection efficiency of the TGFβ3 plasmid was confirmed by RT‐qPCR, Western blot assays and semiquantitative analyses. The results are shown using GAPDH as an endogenous control. The data are presented as the mean ± SEM. **P < 0.01 versus the pEX4‐TGFβ3‐NC group; *** P < 0.005 versus the pEX4‐TGFβ3‐NC group; E, CCK‐8 assay was applied to evaluate of endogenously expressed TGFβ3 on the proliferation of human CFs. ***P < 0.005 versus the si‐TGFβ3‐NC group; # P < 0.05 versus the pEX4‐TGFβ3‐NC group. F, MTT assay was applied to evaluate of endogenously expressed TGFβ3 on the cytotoxicity of human CFs. **P < 0.01 versus the si‐TGFβ3‐NC group; # P < 0.05 versus the pEX4‐TGFβ3‐NC group. G,H, Transwell assay was applied to evaluate of endogenously expressed TGFβ3 on the migration of human CFs. **P < 0.01 versus the si‐TGFβ3‐NC group; ##P < 0.01 versus the pEX4‐TGFβ3‐NC group; I,J, Western blot analyses for collagen I and III, LOX and OPN expression in human CFs with endogenous TGFβ3. The results are shown using GAPDH as an endogenous control. The data are presented as the mean ± SEM. *P < 0.05 versus the si‐TGFβ3‐NC group; **P < 0.01 versus the si‐TGFβ3‐NC group; # P < 0.05 versus the pEX4‐TGFβ3‐NC group. ## P < 0.01 versus the pEX4‐TGFβ3‐NC group. K,L, Western blot, immunofluorescence and semiquantitative analyses for α‐SMA and vimentin. The results are shown using GAPDH as an endogenous control. The data are presented as the mean ± SEM. **P < 0.01 versus the si‐TGFβ3‐NC group; # P < 0.05 versus the pEX4‐TGFβ3‐NC group
