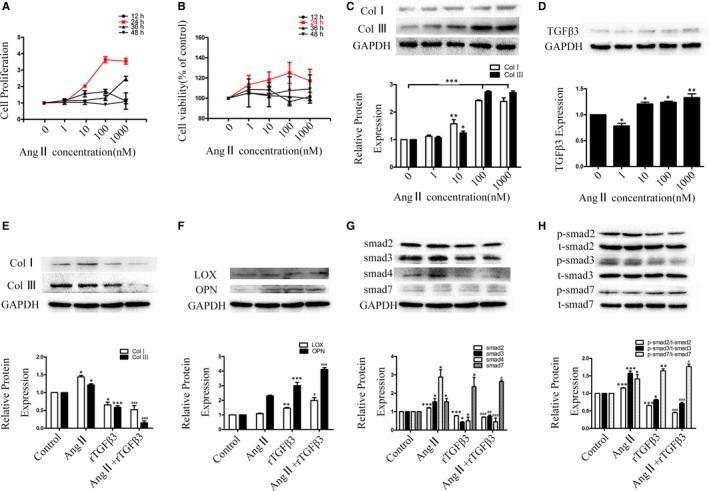
Figure 4.

A, B, CCK‐8 and MTT assays were applied to evaluate the proliferation of Ang II‐induced human CFs. The data are presented as the mean ± SEM. C, Western blot and semiquantitative analyses for collagen Ⅰ and Ⅲ, expressions in Ang Ⅱ‐conditioned human CFs. The results are shown using GAPDH as an endogenous control. The data are presented as the mean ± SEM. *P < 0.05 versus the 0 nmol/L group; **P < 0.01 versus the 0 nmol/L group; ***P < 0.005 versus the 0 nmol/L group; D, Western blot and semiquantitative analyses showing the expression levels of TGFβ3 in human CFs at different concentrations of Ang II. The results are shown using GAPDH as an endogenous control. The data are presented as the mean ± SEM. *P < 0.05 versus the 0 nmol/L group; **P < 0.01 versus the 0 nmol/L group. E,F, Western blot and semiquantitative analyses for collagen Ⅰ, collagen Ⅲ, LOX and OPN expression in Ang Ⅱ (100 nmol/L) and TGFβ3 (10 ng/mL) treatment for 24 hours in human CFs. The results are shown using GAPDH as an endogenous control. The data are presented as the mean ± SEM. *P < 0.05 versus the control group; **P < 0.01 versus the control group; ***P < 0.005 versus the control group; #P < 0.05 versus the Ang Ⅱ group; ###P < 0.005 versus the Ang Ⅱ group; G, H, Effect of p; 24‐h‐Ang Ⅱ (100 nmol/L)‐TGFβ3 (10 ng/mL) treatment on the TGFβ/smad signalling pathway and the relative protein expression. Western blot and semiquantitative analyses for t‐smad2, t‐smad3, smad4, t‐smad7, p‐smad2, p‐smad3 and p‐smad7 expression in human CFs using GAPDH and total smad as endogenous controls. The data are presented as the mean ± SEM.*P < 0.05 versus the control group; **P < 0.01 versus the control group; ***P < 0.005 versus the control group; #P < 0.05 versus the Ang Ⅱ group; ##P < 0.01 versus the Ang Ⅱ group; ###P < 0.005 versus the Ang Ⅱ group
